 English
  Русский
 Bahasa Indonesia
 Bahasa Malay
 ไทย
ไทย Español
 Deutsch
 Български
 Français
 Tiếng Việt
 中文
中文 বাংলা
বাংলা हिन्दी
 Čeština
 Українська
 Română

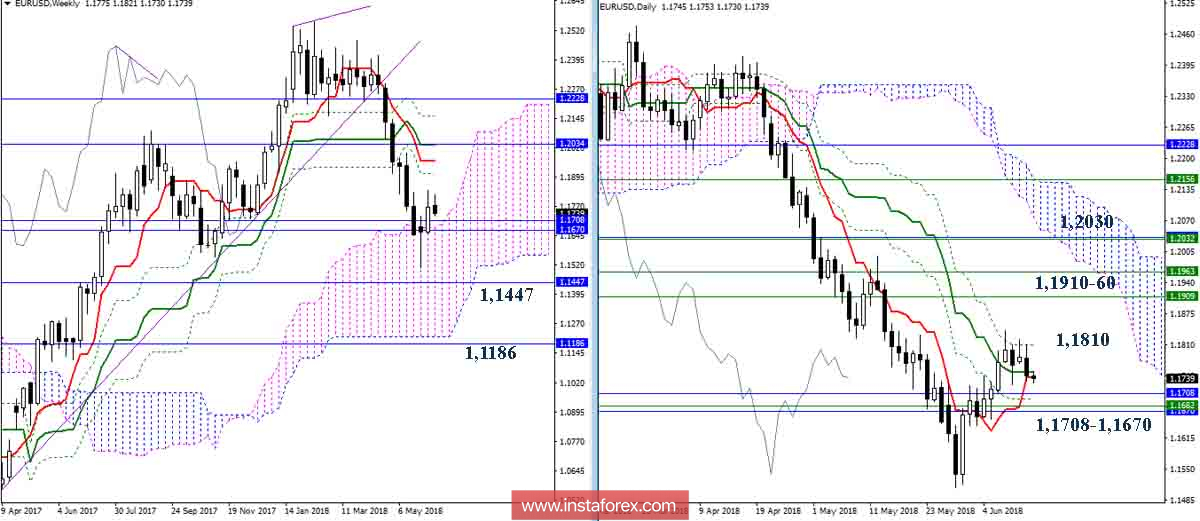
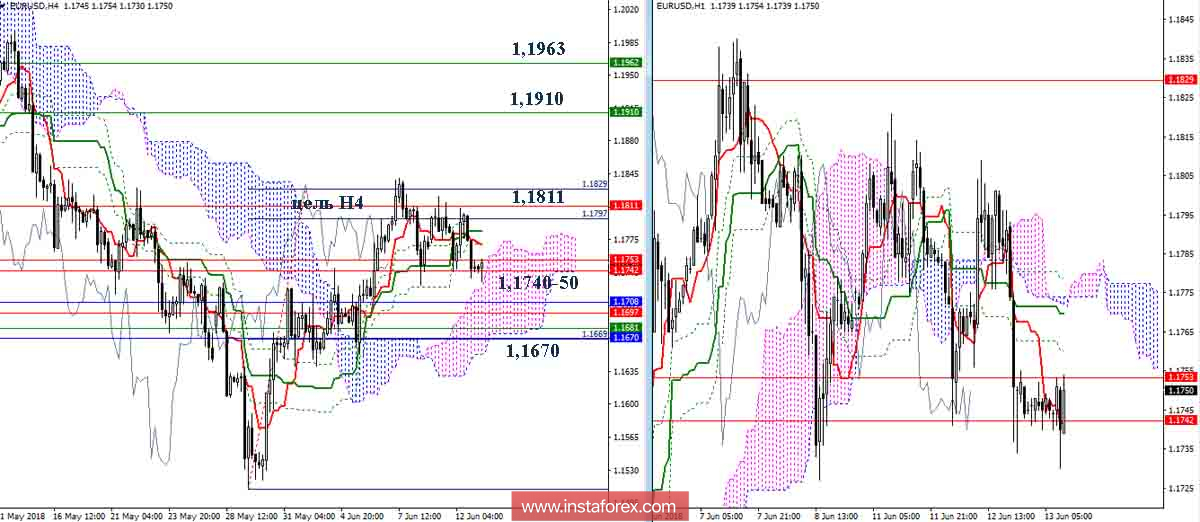
EUR / USD pair
As expected, the players on the rise took a break, having worked out the upward target for the breakdown of the H4 cloud (1.1829) and achieved the final level resistance of the daytime dead cross (Fibo Kijun 1.1810). The key support zone, which combines the boundaries of the monthly and weekly clouds, is in the current situation in the region of 1.1708 - 1.1670. Current support levels are now on the daytime cross and H4 clouds (1.1740-50). The location above the support levels keeps the relevance of the fact the upward correction will continue. The closest reference points, in this case, are the weekly cross and the day cloud (1.1910 - 1.1963 - 1.2032). Reliable fastening under support (1.1708 - 1.1670) can help restore trend movements on the daily and weekly halves (the minimum extremum is 1.1510).
Indicator parameters:
all time intervals 9 - 26 - 52
Color of indicator lines:
Tenkan (short-term trend) - red,
Kijun (medium-term trend) - green,
Fibo Kijun is a green dotted line,
Chikou is gray,
clouds: Senkou Span B (SSB, long-term trend) - blue,
Senkou Span A (SSA) - pink.
Color of additional lines:
support and resistance MN - blue, W1 - green, D1 - red, H4 - pink, H1 - gray,
horizontal levels (not Ichimoku) - brown,
trend lines - purple.