 English
  Русский
 Bahasa Indonesia
 Bahasa Malay
 ไทย
ไทย Español
 Deutsch
 Български
 Français
 Tiếng Việt
 中文
中文 বাংলা
বাংলা हिन्दी
 Čeština
 Українська
 Română

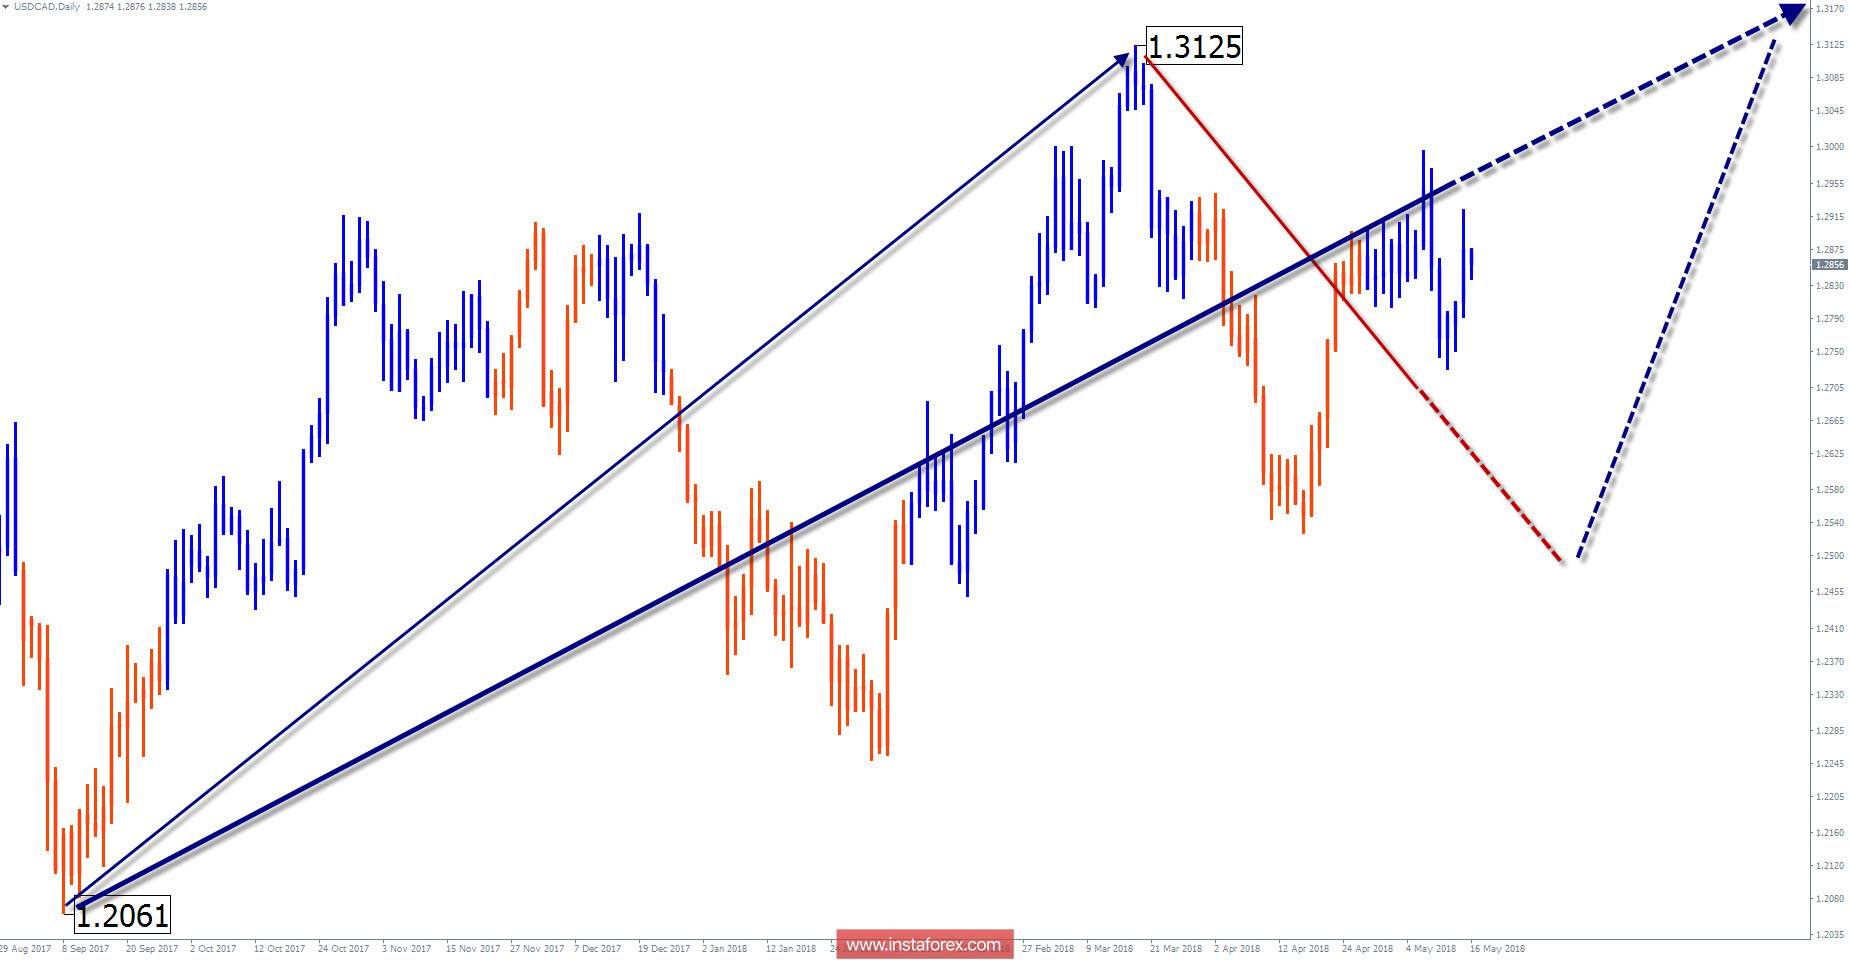
Wave picture of the chart D1:
The unfinished wave design of the major of the Canadian dollar started in September of last year. In the wave structure of a larger TF, the site takes the place of correction. A preliminary calculation of the upside potential indicates a probability of growth of the rate by 4 figures.
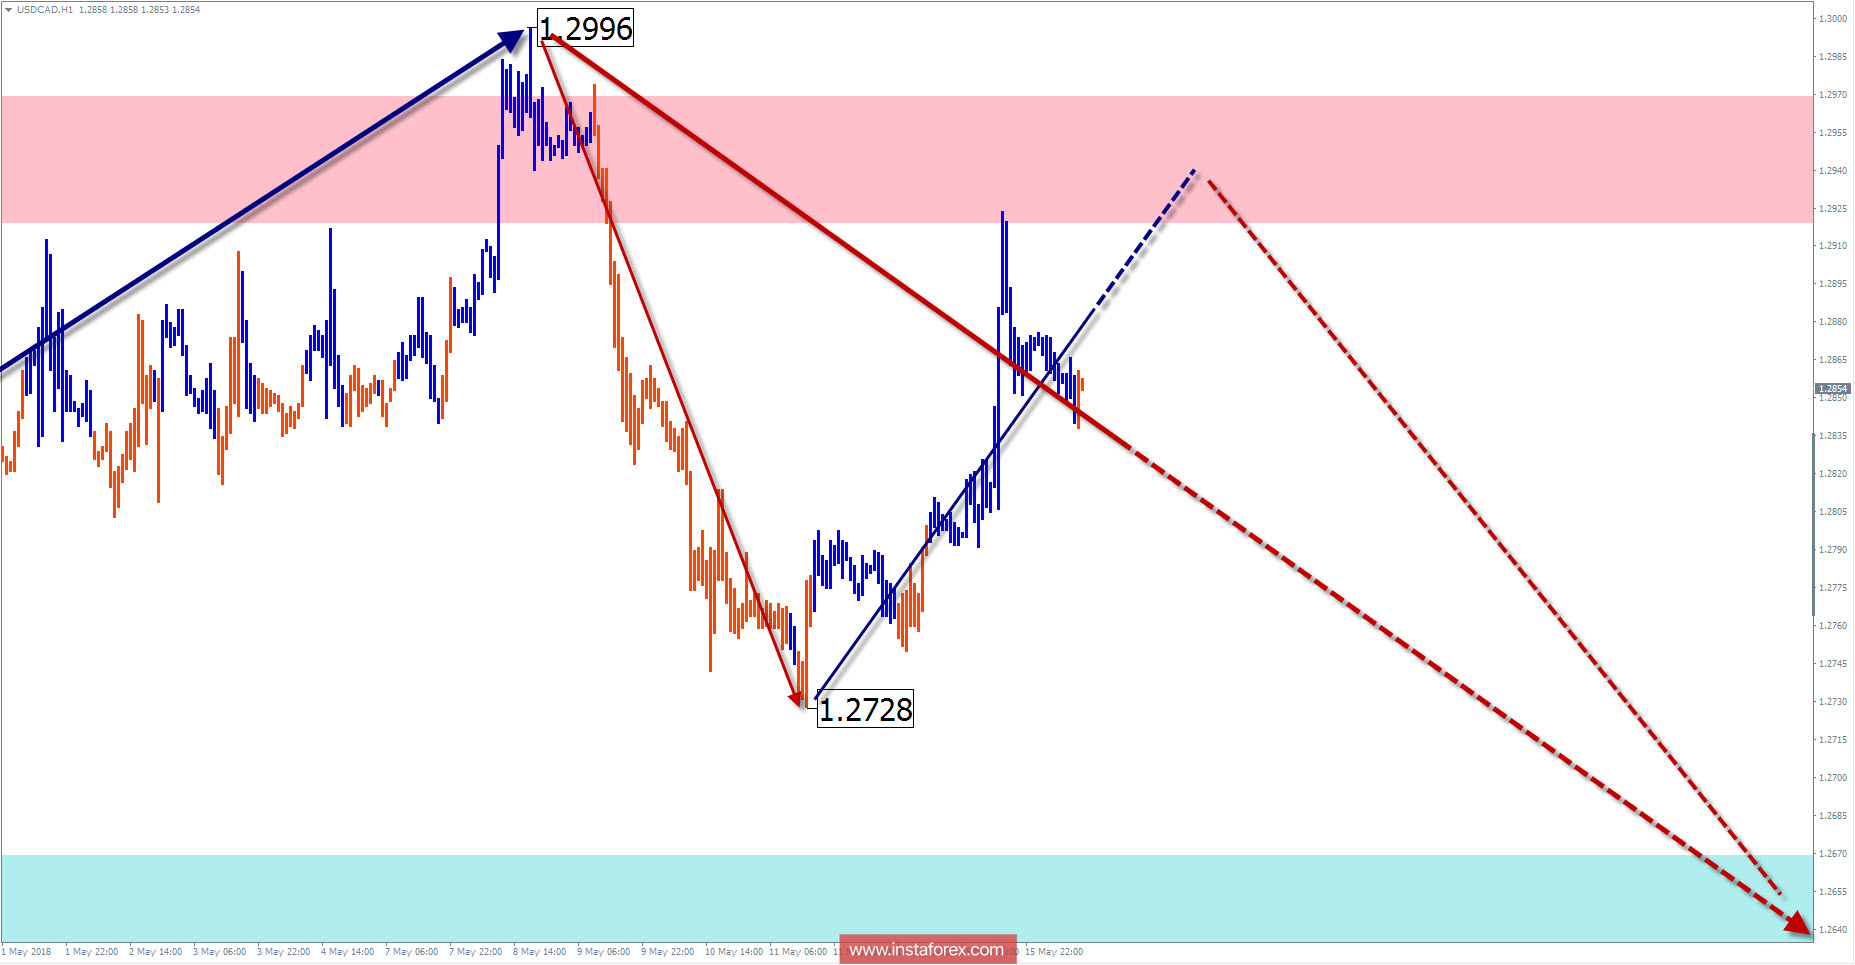
The wave pattern of the graph H1:
The last wave counts since March 19. The structure traces the first 2 parts of the wave zigzag (AB).
The wave pattern of the M15 chart:
The bearish wave of May 8 has a reversal potential. Counter correction can reach the level of the beginning of the wave.
Recommended trading strategy:
If you hold long trades to traders, you can add positions at the end of the current correction. Intraday supporters can search for entrances in the resistance area for the sale of a pair.
Resistance zones:
- 1.2920 / 1.2970
Support zones:
- 1.2670 / 1.2620
Explanations to the figures: Simplified wave analysis uses a simple waveform, in the form of a 3-part zigzag (ABC). At each TF the last incomplete wave is analyzed. Zones show the calculated areas with the greatest probability of a turn.
Arrows indicate the wave counting according to the technique used by the author. The solid background shows the generated structure, dotted - the expected wave motion.
Attention: The wave algorithm does not take into account the duration of the tool movements in time. To conduct a trade transaction, you need confirmation signals from your trading systems!