 English
  Русский
 Bahasa Indonesia
 Bahasa Malay
 ไทย
ไทย Español
 Deutsch
 Български
 Français
 Tiếng Việt
 中文
中文 বাংলা
বাংলা हिन्दी
 Čeština
 Українська
 Română

GBP / JPY
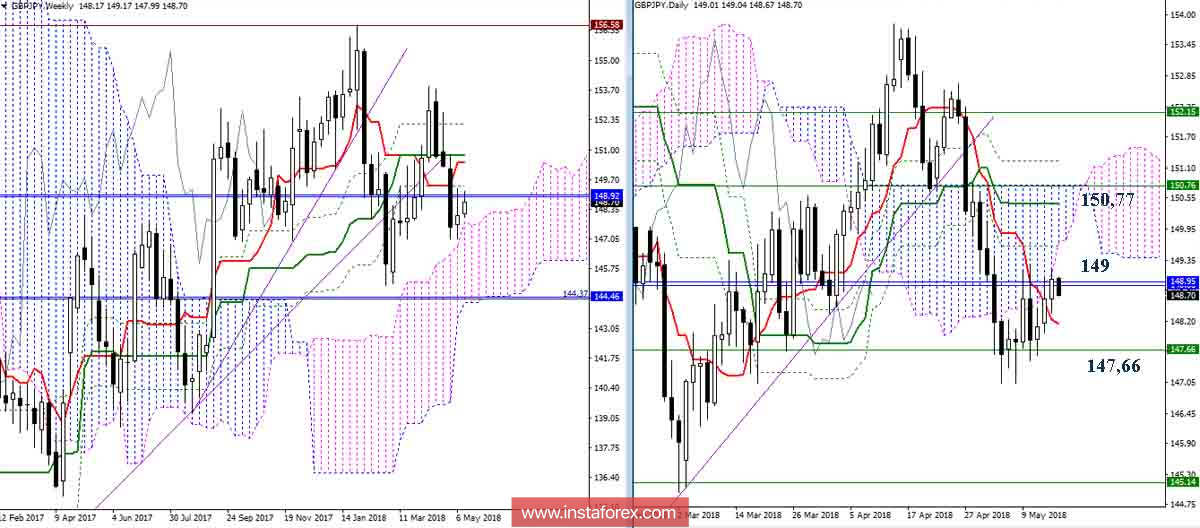
Senior timeframes
The situation, since the last analysis, has not undergone any significant changes. The pair continues to remain in the zone of influence and attraction of the resistances encountered (Senkou Span A of the day cloud 149 + monthly levels of 148.95). The conclusions and expectations remain the same. The players on the downgrade desirably complete the climb on current positions and return to the interaction with support for the upper boundary of the weekly cloud (147.66). The main task for the continuation of the decline is the entry and consolidation in the weekly Ichimoku cloud. In the event that players on the increase can achieve in the near future deepening of the upward correction, the key resistance level is now still the area of 150.77 (weekly cross + day Kijun + Senkou Span B days).
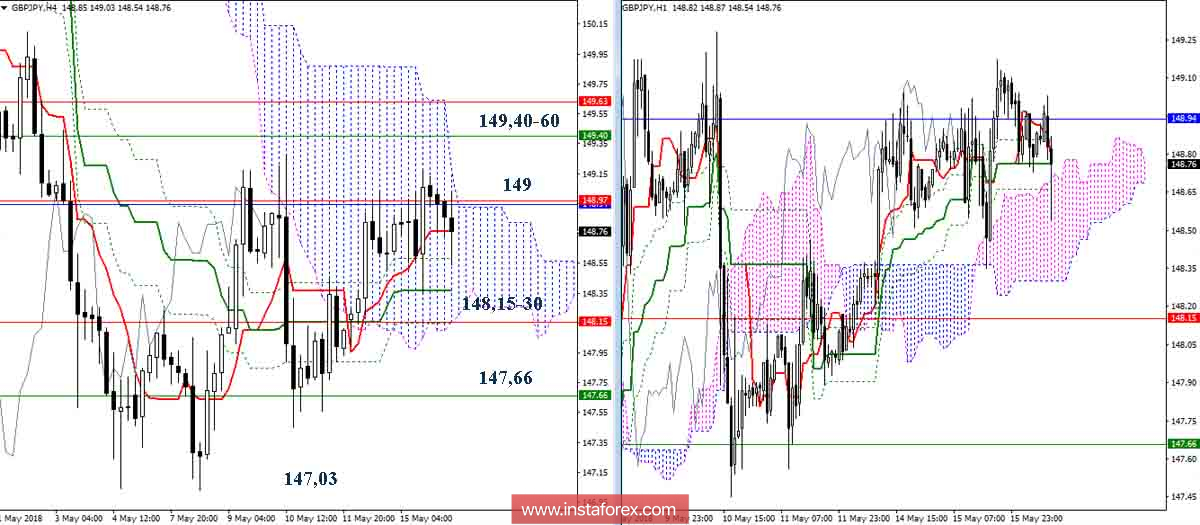
H4-H1
At the lower timeframes, the main resistance is now within the boundaries of the cloud H4. Accordingly, the breakdown of the cloud and reliable fastening above will allow to consider new upward reference points, among which there will be a target for breakdown of the H4 cloud and resistance levels of the older time intervals (149.40-60). The nearest reinforced support zone is currently at 148.30-15 (the final boundaries of the cross H4 + the lower boundaries of clouds H4 and H1), then 147.66 (weekly Senkou Span A) and the update of the minimum correction extremum (147. 03).
Indicator parameters:
All time intervals 9 - 26 - 52
The color of indicator lines:
Tenkan (short-term trend) - red,
Kijun (medium-term trend) - green,
Fibo Kijun is a green dotted line,
Chinkou is gray,
Clouds: Senkou Span B (SSB, long-term trend) - blue,
Senkou Span A (SSA) - pink.
The color of additional lines:
Support and resistance MN - blue, W1 - green, D1 - red, H4 - pink, H1 - gray,
Horizontal levels (not Ichimoku) - brown,
Trend lines - purple.