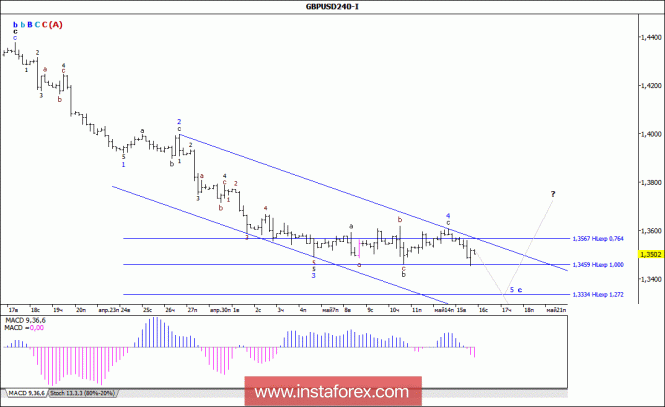
Analysis of wave counting:
Having failed to execute the turn, in the course of yesterday's trading, the currency pair GBP / USD resumed the downward movement, having updated the minimum reached on May 10 (1.3460) and fell to the level of 1.3450 in the afternoon. Thus, it can be assumed that the currency pair nevertheless returned to the process of forming the wave c, b, B, C, C, (A), in the form of a full five-wave structure. If this is the case, then the currency pair may have prospects for lowering quotes up to the level of 1.3175.
The objectives for the option with purchases:
1.3647 - 76.4% of Fibonacci
1.3700
The objectives for the option with sales:
1.3459 - 100.0% of Fibonacci
1.3334 - 127.2% of Fibonacci
General conclusions and trading recommendations:
The tool continues to complicate the wave structure of the wave c, b, B, C, C, (A). Now, I recommend to remain in sales with targets that are near the estimated marks of 1.3459 and 1.3334, which corresponds to 100.0% and 127.2% of Fibonacci. An unsuccessful attempt to reach the 1.3334 mark will warn of the instrument's readiness to build a wave with the first targets located around 37 figures.
 English
 Русский
 Bahasa Indonesia
 Bahasa Malay
 ไทย
ไทย Español
 Deutsch
 Български
 Français
 Tiếng Việt
 中文
中文 বাংলা
বাংলা हिन्दी
 Čeština
 Українська
 Română

