 English
  Русский
 Bahasa Indonesia
 Bahasa Malay
 ไทย
ไทย Español
 Deutsch
 Български
 Français
 Tiếng Việt
 中文
中文 বাংলা
বাংলা हिन्दी
 Čeština
 Українська
 Română

4-hour timeframe
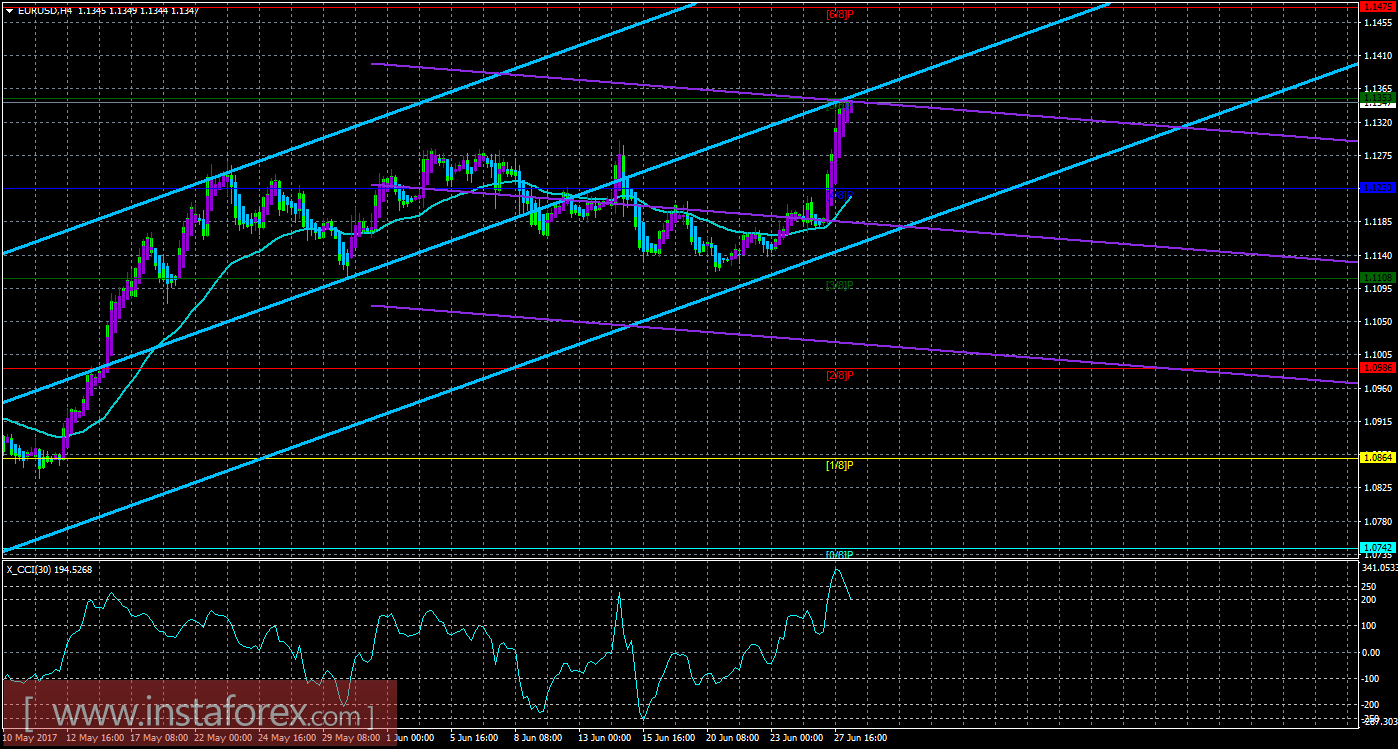
Technical data:
The major channel of linear regression: direction - up.
The minor channel of linear regression: direction - down.
The moving average (20; flattened) is up.
SCI: 194.5268
Explanations:
During trading session on June 28, the EUR / USD pair continued to gain strength as it moves higher, however, there is no any hints that a correction will begin.
As of this writing, the price positioned on top of the moving averages and over the Murray level "4/8".
The acquired target for uptrend came in at Murray's level of "5/8" - 1,135.
The Heiken Ashi indicator colored the last bars in purple which means moving to a higher position.
Short positions can be found underneath the moving average line.
The nearest support levels:
S1 - 1,1230
S2 - 1,1108
S3 - 1,0986
The nearest resistance levels:
R1 - 1,1353
R2 - 1,1475
R3 - 1,1597
Trading recommendations:
Taking consideration of the currency pair, we believe that dealing with long positions are probable with a target of 1, 1353. The next objective can be found at 1.1475.
Aside from the technical report, the market participants should further analyze fundamental data along with the time of release.
Explanation of illustration:
Major channel linear regression - blue lines unidirectional movement.
Minor channel linear regression - purple line unidirectional movement.
CCI - blue line in the indicator window.
Moving average (20; smoothed) - blue line on the chart.
Murray levels - multicolored horizontal stripes.
Heiken Ashi - the indicator bars coloring in blue or purple.