 English
  Русский
 Bahasa Indonesia
 Bahasa Malay
 ไทย
ไทย Español
 Deutsch
 Български
 Français
 Tiếng Việt
 中文
中文 বাংলা
বাংলা हिन्दी
 Čeština
 Українська
 Română

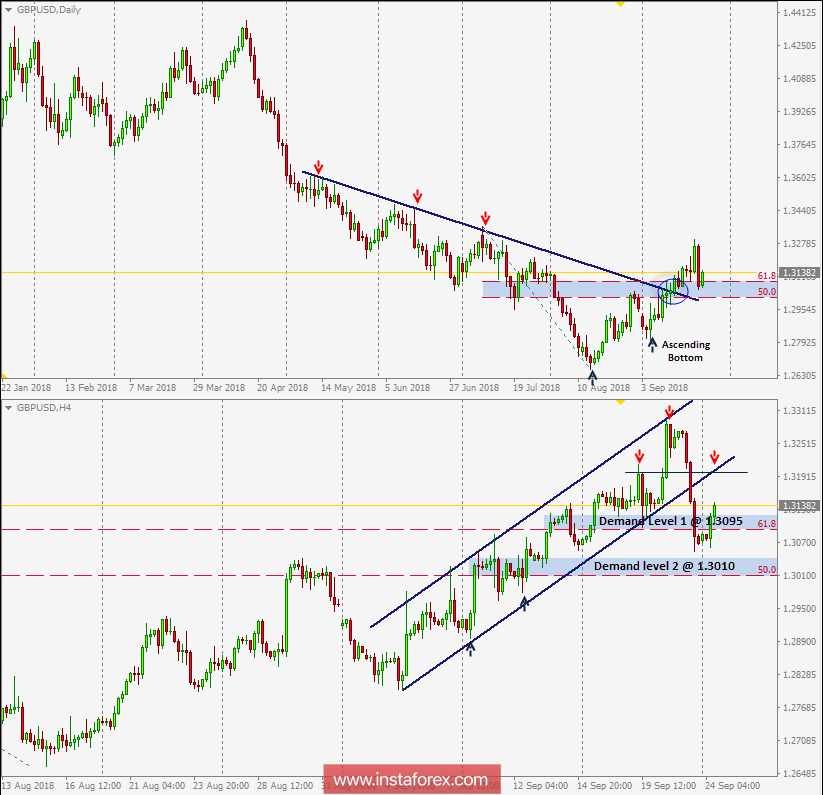
On September 13, the GBP/USD pair was testing the depicted downtrend line which came to meet the pair around 1.3025-1.3090. Since then, the pair has been demonstrating a successful bullish breakout so far.
This price zone (1.3025-1.3090) also corresponds to 50% and 61.8% Fibonacci levels. Currently, this price zone turned to become a prominent demand zone to be watched for bullish price action.
However, On H4 chart, the market failed to maintain its uptrend within the depicted bullish channel on H4 chart. The lower limit of the depicted channel (which came to meet the GBP/USD pair around 1.3190) failed to offer sufficient bullish demand.
As long as the recent bullish breakout above 1.3090 (Demand level-1) is maintained on a daily basis, further bullish advancement should be expected towards 1.3300 and 1.3390 (reversal pattern final target).
On the other hand, the price level of 1.3190 now constitutes a short-term supply level (the backside of the broken bullish channel) where some bearish rejection can be anticipated.
Moreover, any bearish decline below 1.3090 (Demand level-1) will probably invalidate the bullish scenario for the short-term. Hence, the pair would have lower targets around 1.3010 (Demand level-2).