 English
  Русский
 Bahasa Indonesia
 Bahasa Malay
 ไทย
ไทย Español
 Deutsch
 Български
 Français
 Tiếng Việt
 中文
中文 বাংলা
বাংলা हिन्दी
 Čeština
 Українська
 Română

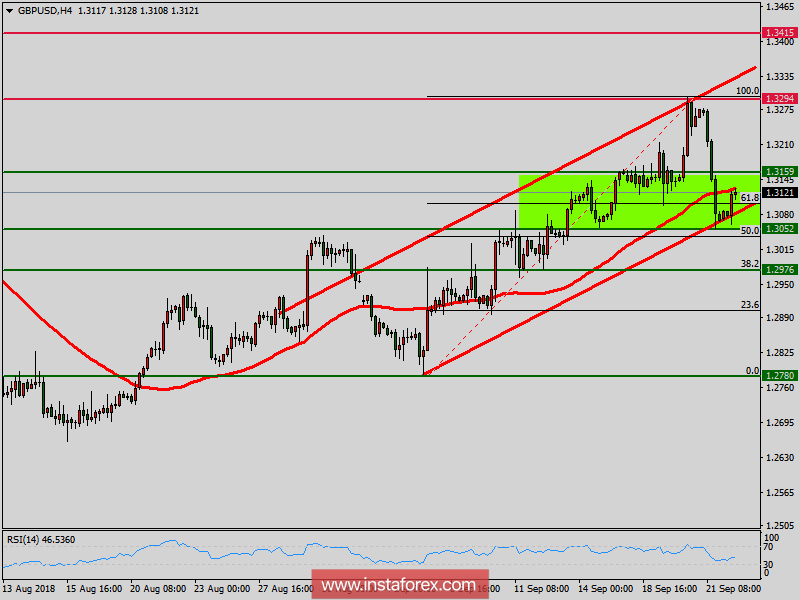
Overview:
The GBP/USD pair continues moving in a bullish trend from the support levels of 1.3052 and 1.3159. Currently, the price is in a bullish channel. This is confirmed by the RSI indicator signaling that we are still in a bullish trending market. As the price is still above the moving average (100), immediate support is seen at 1.3052, which coincides with a golden ratio (61.8% of Fibonacci).
Consequently, the first support is set at the level of 1.3159. So, the market is likely to show signs of a bullish trend around the spot of 1.3159. In other words, buy orders are recommended above the first support of 1.3159 with the first target at the level of 1.3294. Furthermore, if the trend is able to breakout through the first resistance level of 1.3294. We should see the pair climbing towards the double top (1.3294) to test it. If the trend will be able to break the double top at 1.3294, then the GBP/USD will continue towards the next objective of 1.3415. It would also be wise to consider where to place a stop loss; this should be set below the second support of 1.3052.