 English
  Русский
 Bahasa Indonesia
 Bahasa Malay
 ไทย
ไทย Español
 Deutsch
 Български
 Français
 Tiếng Việt
 中文
中文 বাংলা
বাংলা हिन्दी
 Čeština
 Українська
 Română

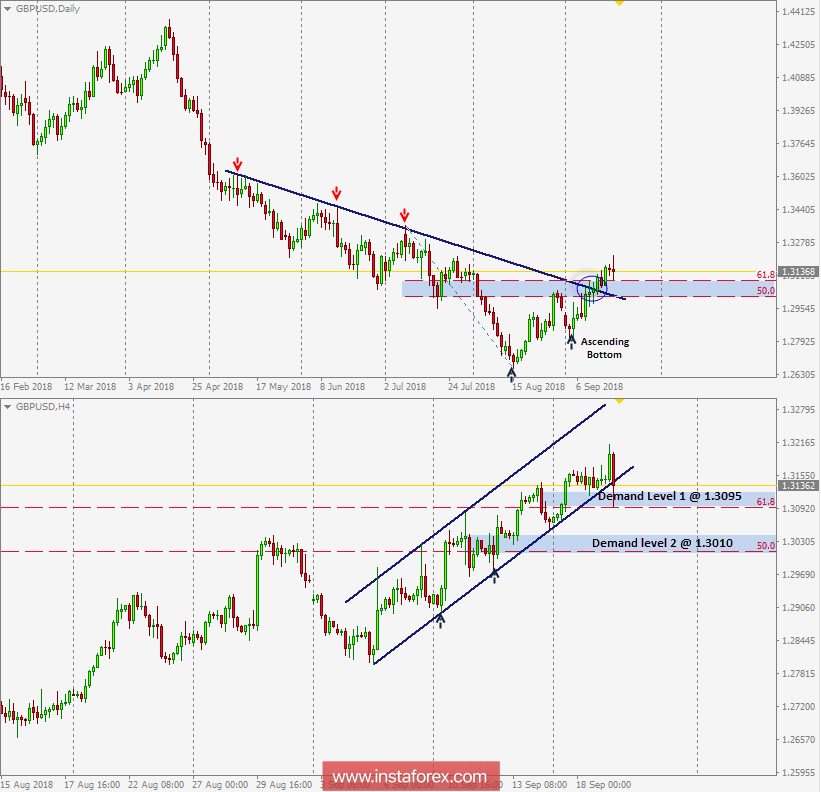
The recent bearish momentum of the GBP/USD has shown signs of weakness since September 5 when an ascending bottom was established around 1.2800
The GBP/USD pair was testing the depicted downtrend line which came to meet the pair around 1.3025-1.3090. This week, the pair has been demonstrating a successful bullish breakout so far.
This price zone (1.3025-1.3090) also corresponds to 50% and 61.8% Fibonacci levels. These levels failed to offer enough bearish pressure. Instead, this price zone turned to become a prominent demand zone to be watched for price action.
The GBP/USD pair continues to demonstrate its uptrend within the depicted bullish channel on H4 chart.
As long as the current bullish breakout above 1.3090 (Demand level-1 and the lower limit of the H4 channel) is maintained, further bullish advancement should be expected towards 1.3200, 1.3250 and 1.3315.
On the other hand, any bearish decline below 1.3090 (Demand level-1) will probably invalidate the bullish scenario for the short-term. Hence, the pair would have lower targets around 1.3010 (Demand level-2).