 English
  Русский
 Bahasa Indonesia
 Bahasa Malay
 ไทย
ไทย Español
 Deutsch
 Български
 Français
 Tiếng Việt
 中文
中文 বাংলা
বাংলা हिन्दी
 Čeština
 Українська
 Română

The Gold price remains in a bearish trend making lower lows and lower highs. The Gold price is above the $1,240-37 support area and below the Ichimoku cloud in the 4hour chart. As long as Gold is below $1,252 we should expect more downside. Prices are oversold though at current levels and I will not be looking to chase short positions.
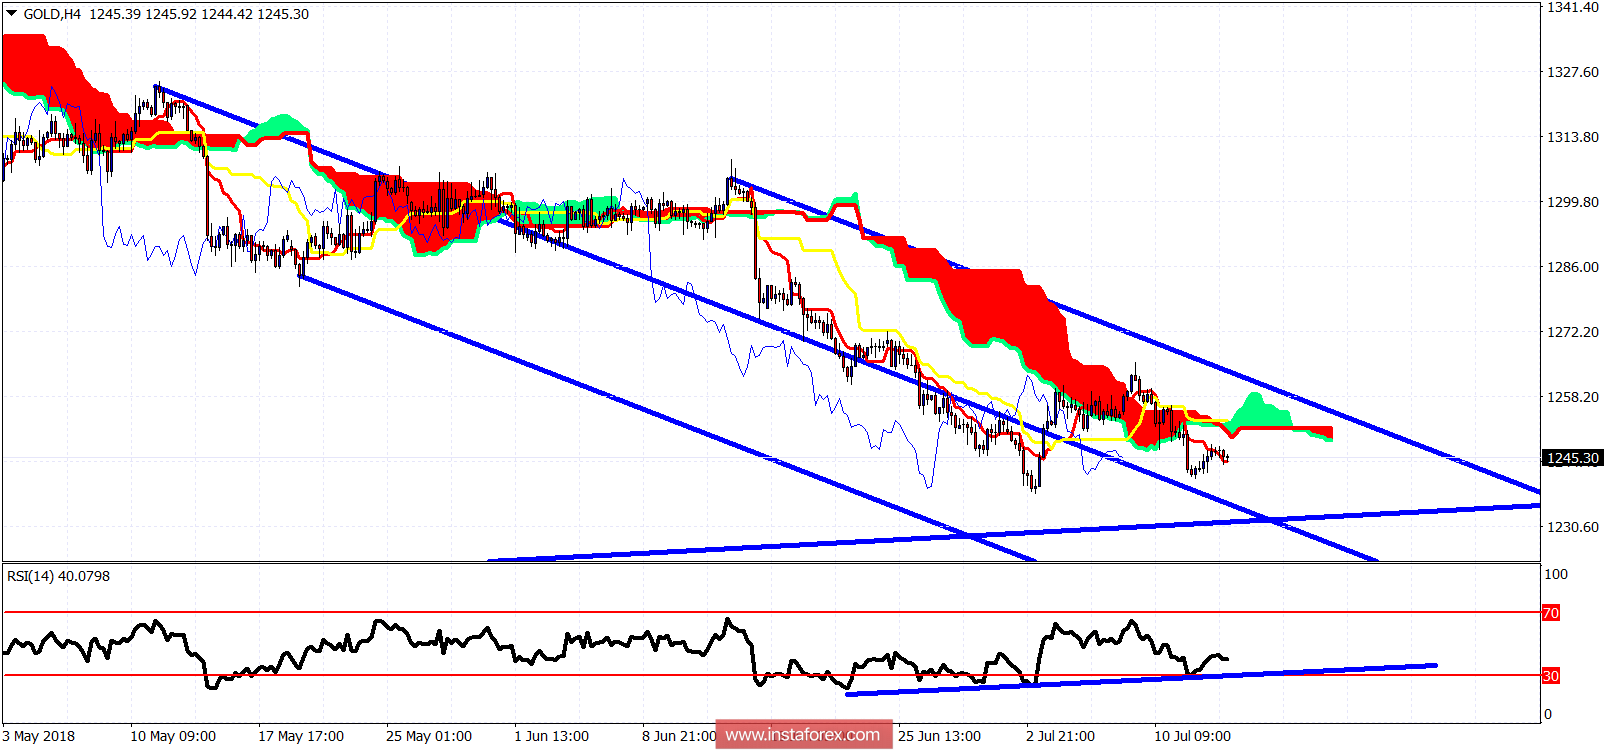
Upward sloping blue line - RSI support trend line
The Gold price is below the 4-hour Kumo. Support is at $1,240 and next at $1,235. Resistance is at $1,250 and at $1,253. Above this level, we should expect Gold to push towards $1,260 and next towards $1,272. A break below $1,235-40 area will open the way for a push lower towards $1,220-$1,200.