 English
  Русский
 Bahasa Indonesia
 Bahasa Malay
 ไทย
ไทย Español
 Deutsch
 Български
 Français
 Tiếng Việt
 中文
中文 বাংলা
বাংলা हिन्दी
 Čeština
 Українська
 Română

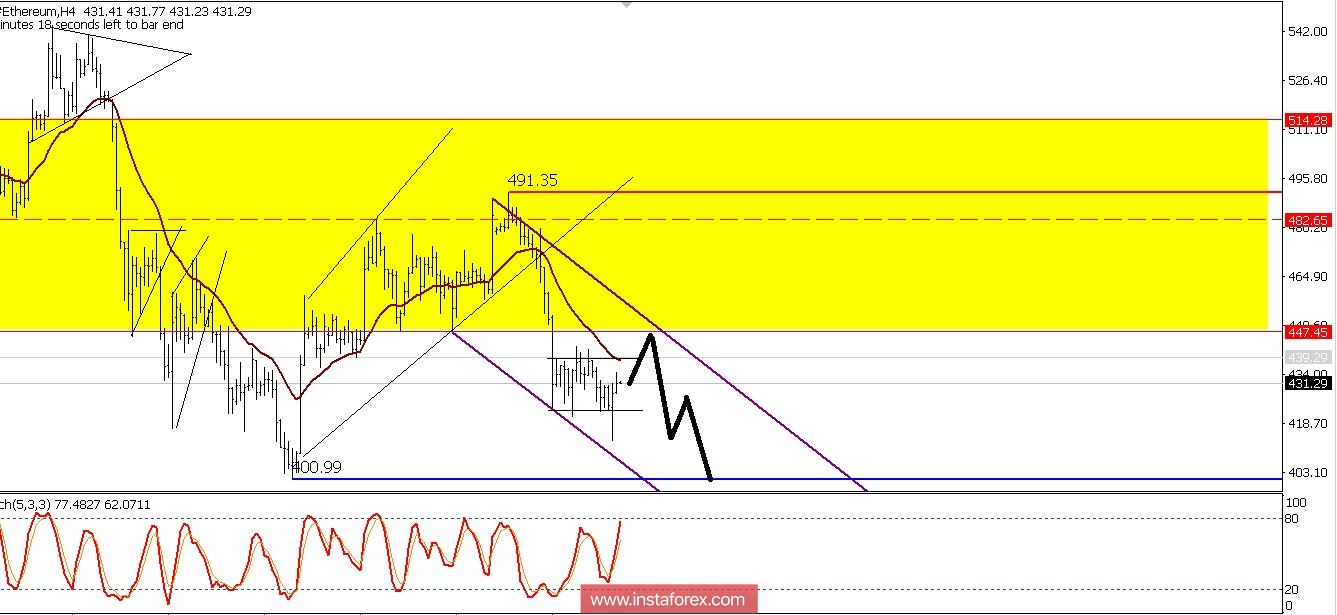
At the 4-hour chart, we can see the Ethereum moving in a Bearish bias. Besides the price is now moving below the Moving Average 21 period and the slope is pointing down, the price already made a few Bearish chart patterns, for now, it seems the Ethereum will try to break out below the Rectangle pattern, as long as the Ethereum does not break out and close above the 491.35 most of the time it is likely it will continue its previous Bearish bias.
(Disclaimer)