 English
  Русский
 Bahasa Indonesia
 Bahasa Malay
 ไทย
ไทย Español
 Deutsch
 Български
 Français
 Tiếng Việt
 中文
中文 বাংলা
বাংলা हिन्दी
 Čeština
 Українська
 Română

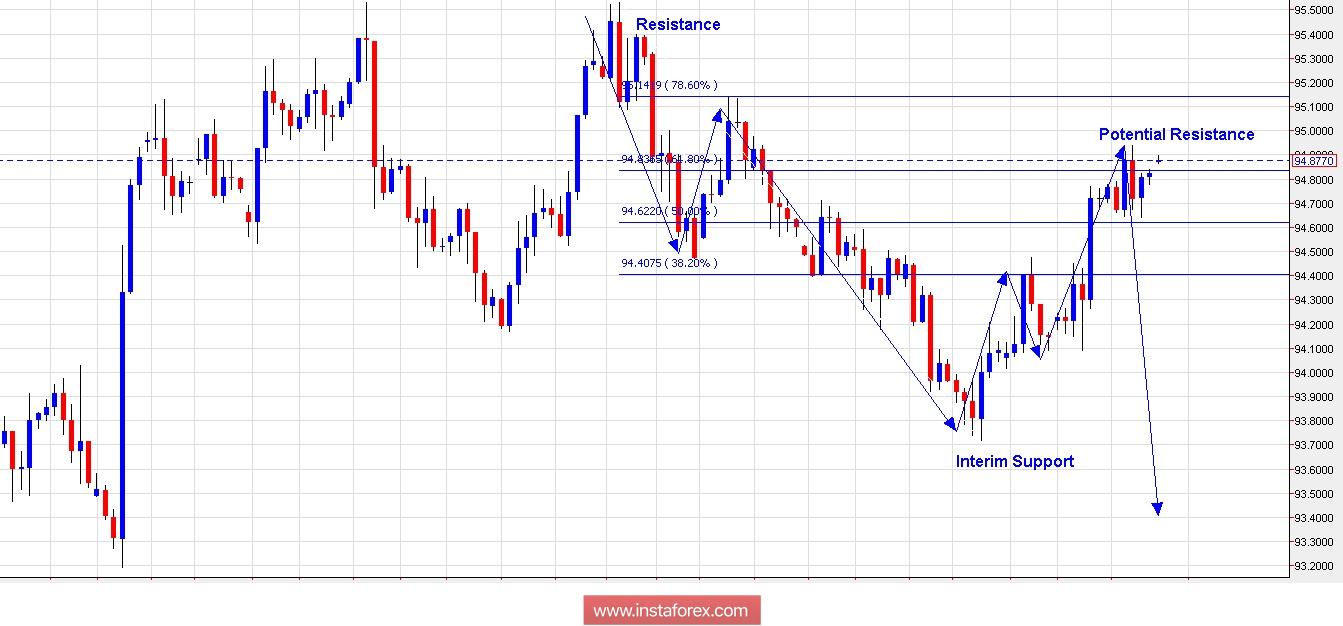
Technical outlook:
The US Dollar Index is seen to be trading around the potential resistance zone at the 94.80/95.00 levels. Also please note the Fibonacci 0.618 resistance passing through the 94.85 levels as depicted here. A bearish turn seems to be the high probable move from here, bottom line prices should remain below the 95.50 levels for now. Also note that the US Dollar Index might be working on wave (4) of a higher degree and until prices stay above the 91/92 levels, the count remains valid. For now, bears should be back in control from around these levels and continue to drag prices below 93.80 at least. On the flip side, if resistance at 95.50 is taken off, it would mean that bulls are targeting the 98.00 levels before taking a meaningful correction.
Trading plan:
Remain short from here, stop above 95.50, target at 93.00.
Fundamental Outlook:
Watch out for USD U. Michigan at 1000 AM EST, followed by Fed Monetary Policy to Congress at 1100 AM EST.
Good luck!