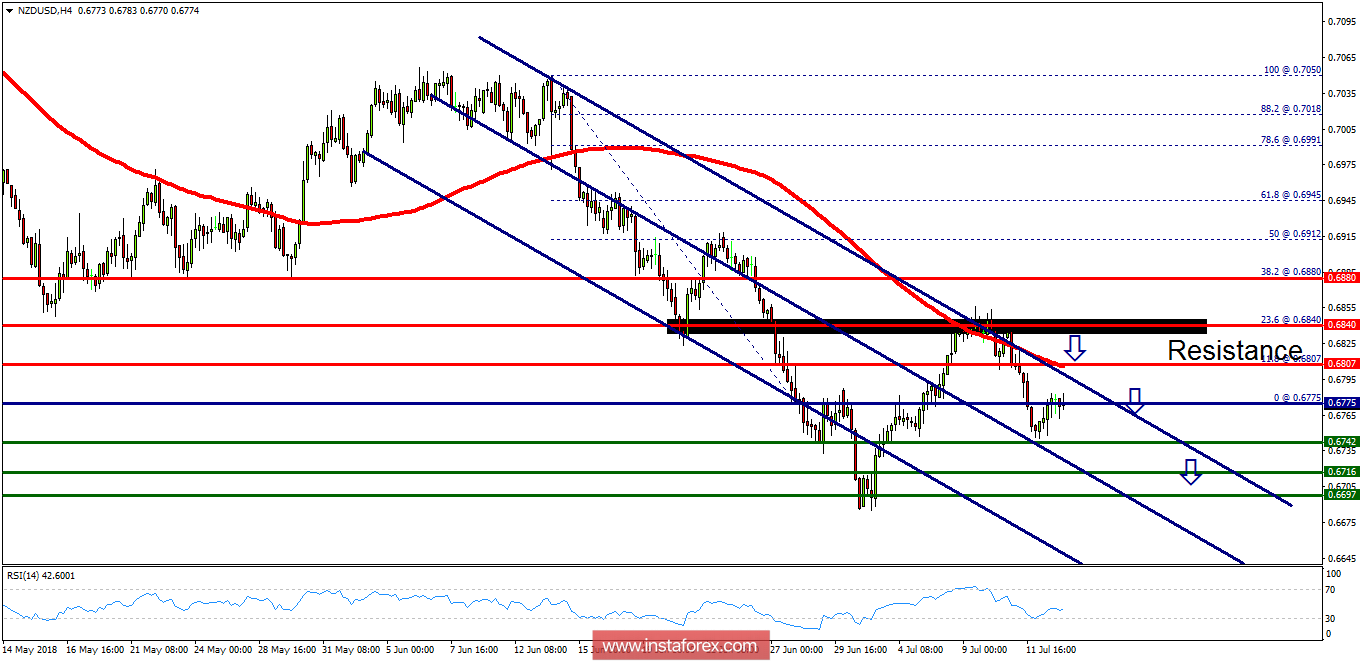
Overview: The NZD/USD pair continues to move downwards from the level of 0.6840 (23.6% of Fibonacci retracement). This week (from 9 to 13 July 2018), the pair has dropped from the level of 0.6840 to trade around the 0.6775 level. This level of 0.6840 coincides with the major resistance today. Today, the first resistance level is seen at 0.6840 followed by 0.6880, while daily support 1 is found at 0.6742. Also, the level of 0.6775 represents a key price today for that it is acting as major resistance/support this week. Amid the previous events, the pair is still in a downtrend, because the NZD/USD pair is trading in a bearish trend from the new resistance line of 0.6840/0.6807 towards the first support level at 0.6742 in order to test it. If the pair succeeds to pass through the level of 0.6742, the market will indicate a bearish opportunity below the level of 0.6742. Then, resell again at the price of 0.6742 with the targets of 0.6716 and 0.6697. On the other hand, if a breakout happens at the resistance level of 0.6843, then this scenario may be invalidated.
*The market analysis posted here is meant to increase your awareness, but not to give instructions to make a trade
 English
  Русский
 Bahasa Indonesia
 Bahasa Malay
 ไทย
ไทย Español
 Deutsch
 Български
 Français
 Tiếng Việt
 中文
中文 বাংলা
বাংলা हिन्दी
 Čeština
 Українська
 Română
 Long-term review