 English
  Русский
 Bahasa Indonesia
 Bahasa Malay
 ไทย
ไทย Español
 Deutsch
 Български
 Français
 Tiếng Việt
 中文
中文 বাংলা
বাংলা हिन्दी
 Čeština
 Українська
 Română

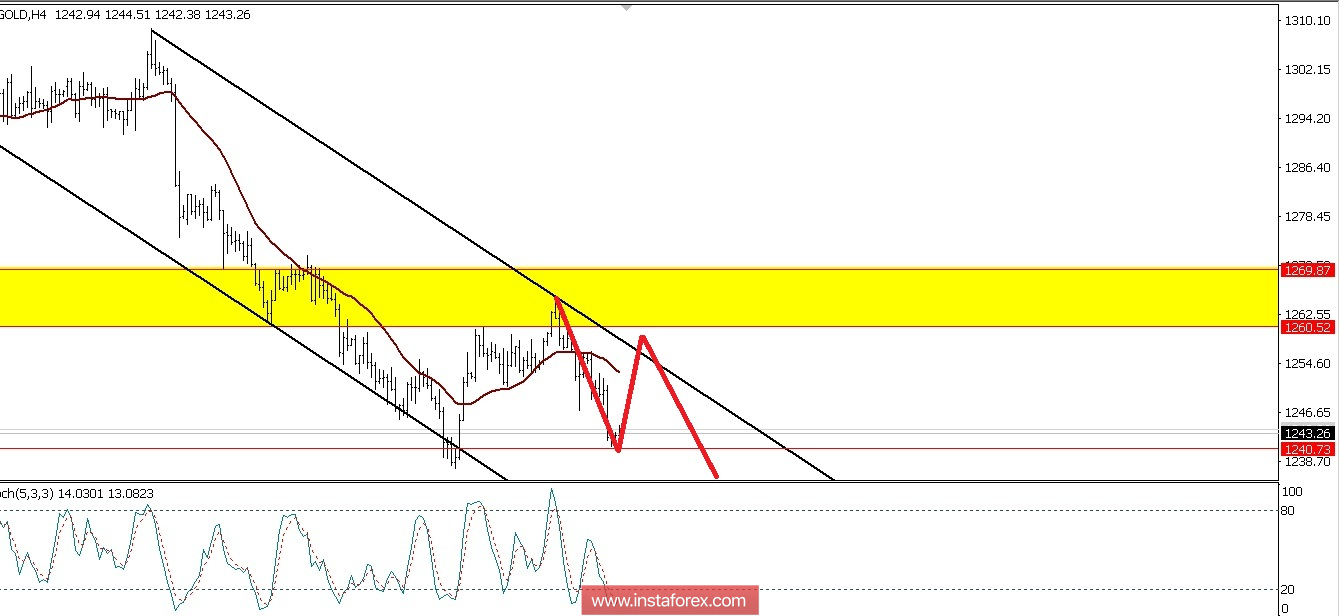
On the 4-hour chart, we see that gold carried out its downmove after touching the key support level at $1,240.73. At the same time, the Stochastic Oscillator has already got into the oversold area. Now, the price seems to head upward up to make correction as the requirement for clear-cut trend before the price resumes its previous bearish trend. Gold is likely to test between the 21-period moving average. Otherwise, we will see the upper channel from the down slope channel or back to the SBR (Support Become Resistance) Zone 1260.52 - 1269.87. As long as gold does not break out and closes above the $1,269.87 level, the odds are that gold will resume its previous bearish bias.
(Disclaimer)