 English
  Русский
 Bahasa Indonesia
 Bahasa Malay
 ไทย
ไทย Español
 Deutsch
 Български
 Français
 Tiếng Việt
 中文
中文 বাংলা
বাংলা हिन्दी
 Čeština
 Українська
 Română

Technical outlook:
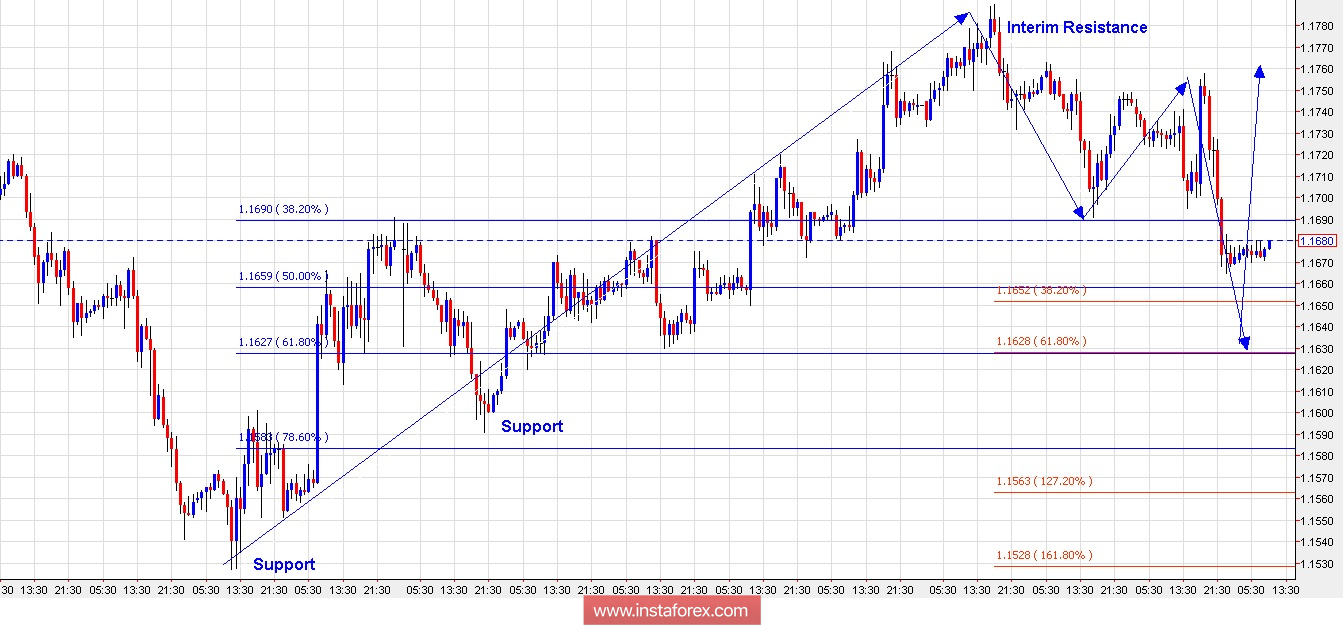
The hourly EUR/USD chart presented here indicates that the currency pair is dropping in a corrective manner since printing highs at the 1.1790 levels recently. At this point in time, prices are finding support at a past resistance turned support zone around the 1.1660/70 levels. According to the Fibonacci extensions displayed here, it remains quite possible for the pair to drop through the 1.1650/30 levels to find further support before turning higher. The price support is seen at the 1.1590 levels, followed by the 1.1530 levels, respectively, while interim resistance is seen at the 1.1790 levels. Most probable direction is to push higher at least one last time towards 1.1850 and above, before reversing lower again. Please note that in the medium term, till the prices remain below the 1.2150 levels, bears shall be in complete control.
Trade plan:
Aggressive traders, now look to buy again between the 1.1630/60 levels, with stop below 1.1550 and target above 1.1850.
Fundamental outlook:
Watch out for USD CPI at 0800 AM EST today.
Good luck!