 English
  Русский
 Bahasa Indonesia
 Bahasa Malay
 ไทย
ไทย Español
 Deutsch
 Български
 Français
 Tiếng Việt
 中文
中文 বাংলা
বাংলা हिन्दी
 Čeština
 Українська
 Română

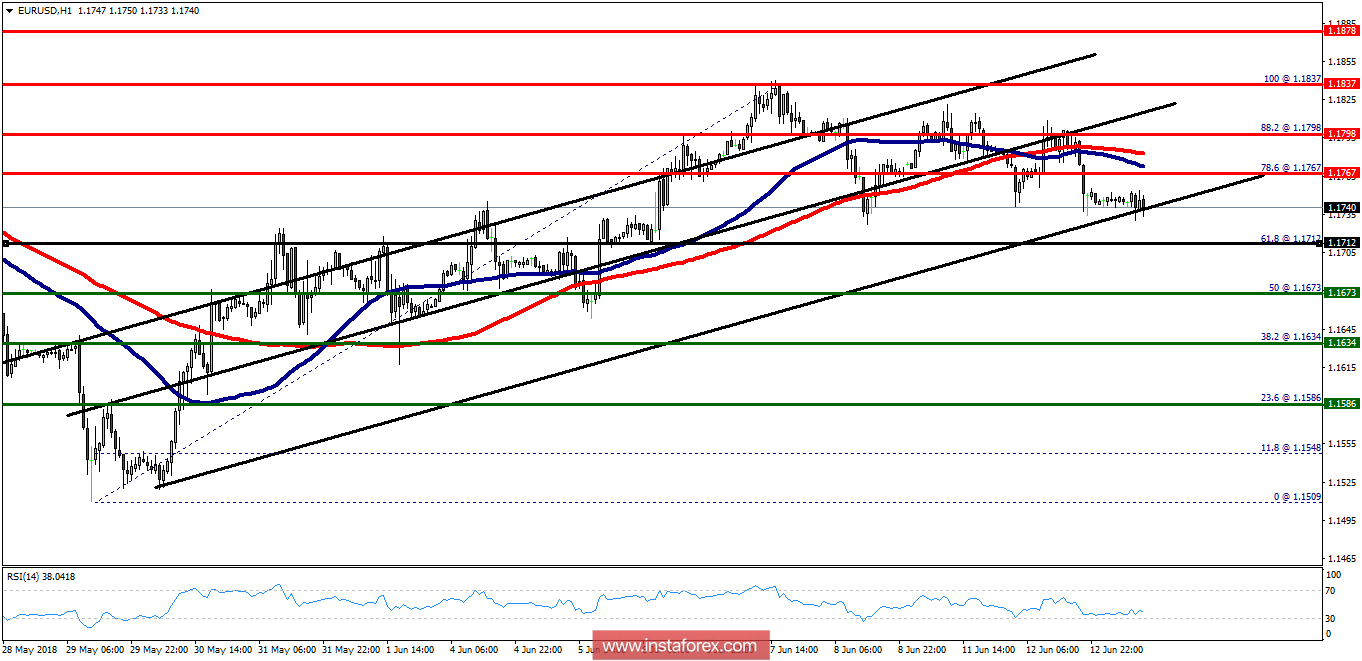
The EUR/USD pair rose from the level of 1.1673 towards 1.1837 this week. Now, the current price is set at 1.1743. On the H1 chart, the resistance is seen at the levels of 1.1798 and 1.1837. Besides, the weekly support 1 is seen at the level of 1.1673. Today, the EUR/USD pair is continuing to move in a bullish trend from the new support level of 1.1673, to form a bullish channel. Amid the previous events, we expect the pair to move between 1.1673 and 1.1837. Therefore, buy above the level of 1.1673 with the first target at 1.1798 in order to test the daily resistance 1 and further to 1.1837 (double top). Nevertheless, if the pair fails to pass through the level of 1.1673, the market will indicate a bearish opportunity below the level of 1.1673. The market will decline further to 1.1634 in order to return to the last bearish wave. Additionally, a breakout of that target will move the pair further downwards to 1.1586.
Comment:
- The weekly pivot is seen at the level of 1.1712.
- The market is still in an uptrend. We still prefer the bullish scenario.