 English
  Русский
 Bahasa Indonesia
 Bahasa Malay
 ไทย
ไทย Español
 Deutsch
 Български
 Français
 Tiếng Việt
 中文
中文 বাংলা
বাংলা हिन्दी
 Čeština
 Українська
 Română

Gold price remains near its weekly lows. Gold price has reached important support area and could start a reversal from current levels. Gold price is testing important weekly cloud support. I'm bullish at current levels but I would get aggressively bullish above $1,300.
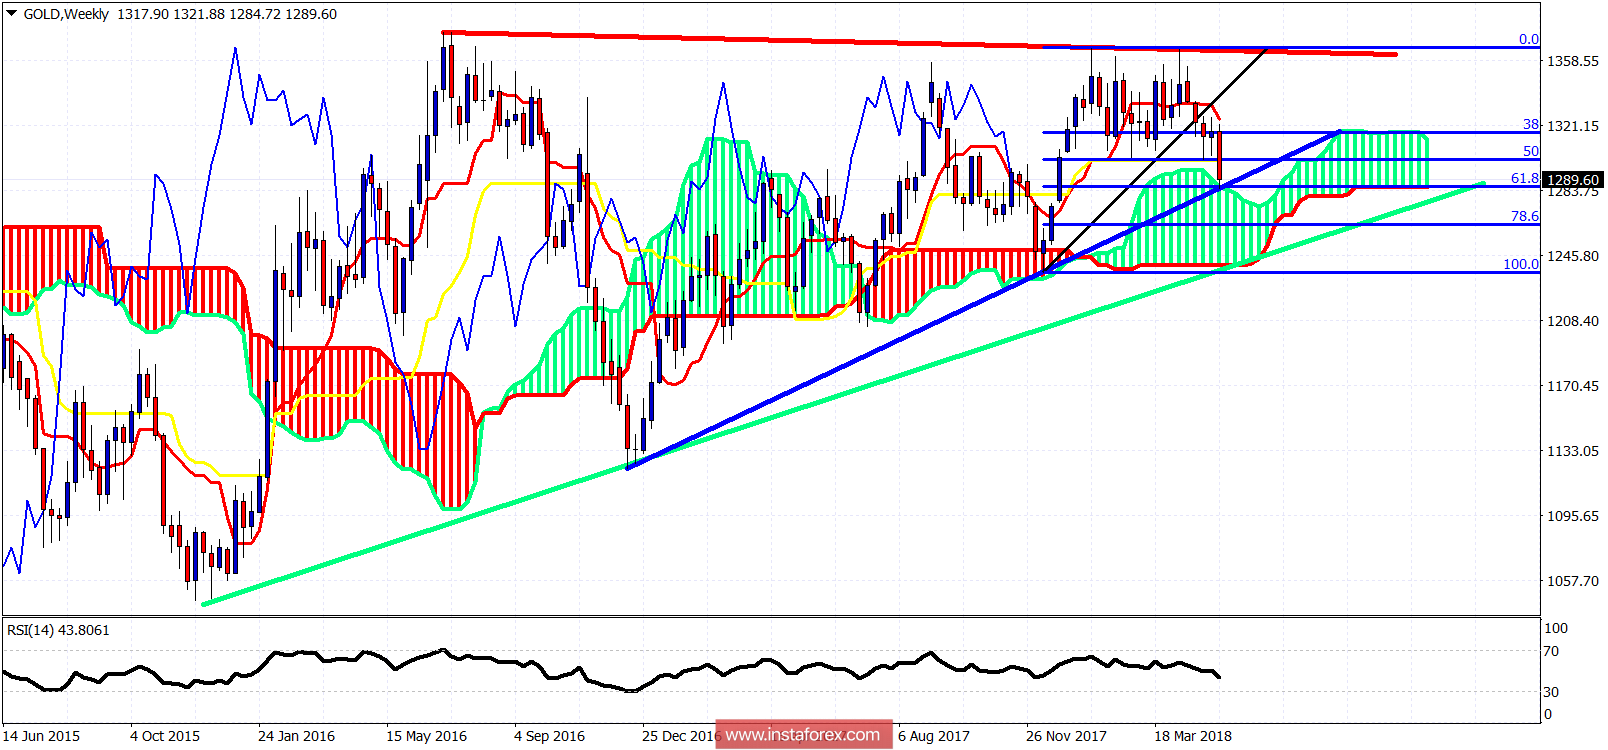
Red line - long-term resistance
Blue line - medium-term support
Green line -long-term support
Gold price is touching the upper boundary of the weekly Kumo (cloud). This is very important support. This area is also support by the blue upward sloping trend line and by the 61.8% Fibonacci retracement. We have a confluence of support indicators at current levels. I'm bullish at current levels. I expect Gold to reverse to the upside and start a move towards $1,400-$1,425 over the coming months.