 English
  Русский
 Bahasa Indonesia
 Bahasa Malay
 ไทย
ไทย Español
 Deutsch
 Български
 Français
 Tiếng Việt
 中文
中文 বাংলা
বাংলা हिन्दी
 Čeština
 Українська
 Română

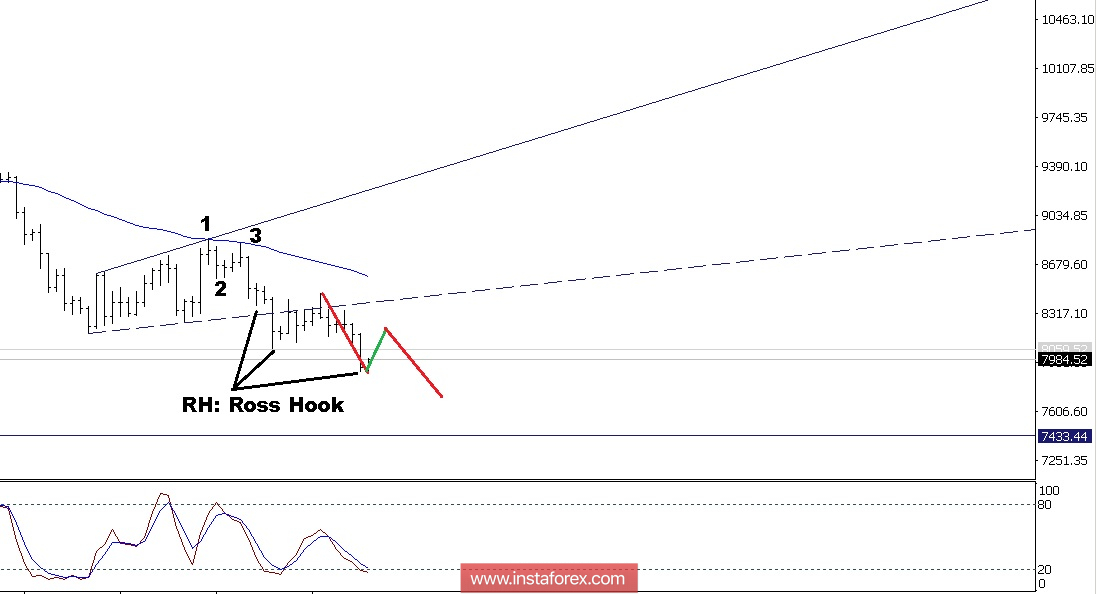
If we look at the 4-hour chart on Bitcoin, we can see that Bitcoin is trading with a bearish bias. The crypto-currency is already making an upward broadening channel (Weak Bull) and broke its support. Now Bitcoin is trying to test the next support level at $7,433.44 level, but there must be a correction to re-test the previous support level which became the new resistance level (because the stochastic oscillator is already in the oversold condition) at $8064.16-$8,173.44 level. However, as long as the #BTC does not breakout and keeps slightly above $8,463.60, the digital currency is likely to continue the bearish bias and to test the next support level at $7,433.44.
(Disclaimer)