 English
  Русский
 Bahasa Indonesia
 Bahasa Malay
 ไทย
ไทย Español
 Deutsch
 Български
 Français
 Tiếng Việt
 中文
中文 বাংলা
বাংলা हिन्दी
 Čeština
 Українська
 Română

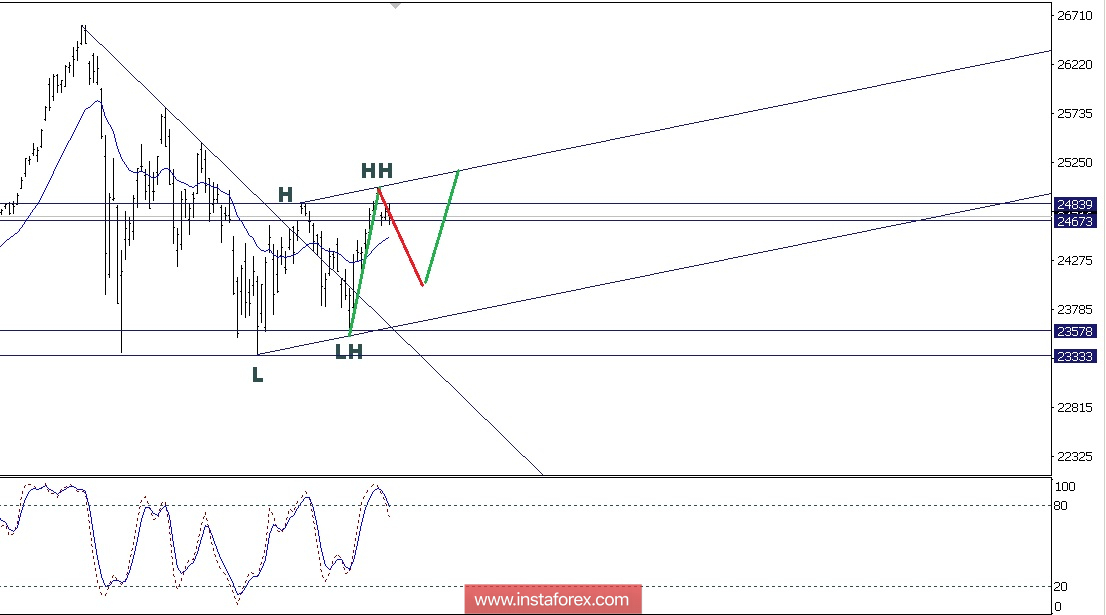
After breakout from the Triangle Pattern on the daily chart, Dow Jones Industrial Average is making a higher high and lower low. We know this pattern seems to give a clue for the index close. It is in a correction phase and it is about get back to the bullish bias as long as no breakout has happened. Now, the index is bellow the 23,344 level. There is a high possibility for the index to test the previous resistance at 25,448 as the first target and 25,800 as the second target.
(Disclaimer)