 English
  Русский
 Bahasa Indonesia
 Bahasa Malay
 ไทย
ไทย Español
 Deutsch
 Български
 Français
 Tiếng Việt
 中文
中文 বাংলা
বাংলা हिन्दी
 Čeština
 Українська
 Română

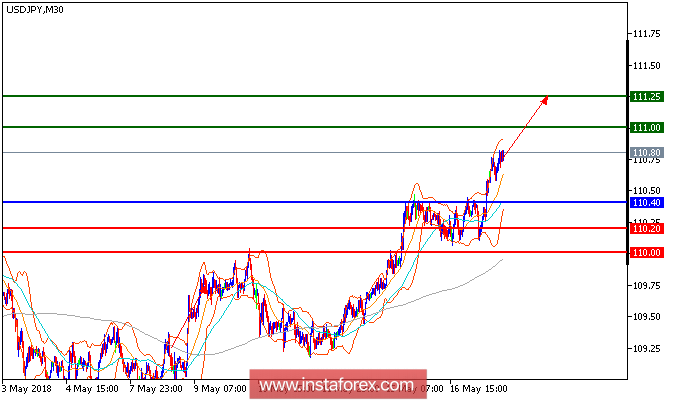
All our upside targets which we predicted in previous analysis have been hit. The pair is still trading in a higher range and expected to continue the upside movement. USD/JPY is proceeding toward the overhead resistance at 111.00 while being supported by the ascending 20-period moving average, which has just crossed above the 50-period one. The level of 110.40 has proven a strong downside support. The intraday configuration remains bullish, and the pair should target 111.25 upon reaching 111.25.
Chart Explanation: The black line shows the pivot point. The present price above the pivot point indicates a bullish position, and the price below the pivot point indicates a short position. The red lines show the support levels, and the green line indicates the resistance levels. These levels can be used to enter and exit trades.
Strategy: BUY, stop loss at 110.40, take profit at 111.00.
Resistance levels: 111, 111.25, and 111.50
Support levels: 110.20, 110.00, and 109.60.