 English
  Русский
 Bahasa Indonesia
 Bahasa Malay
 ไทย
ไทย Español
 Deutsch
 Български
 Français
 Tiếng Việt
 中文
中文 বাংলা
বাংলা हिन्दी
 Čeština
 Українська
 Română

The USD/CAD is in a bearish trend making lower lows and lower highs. Price is trading below the Ichimoku cloud and recently got rejected when it tried to bounce towards 1.2930. I'm bearish USD/CAD specially if we break below 1.2730.
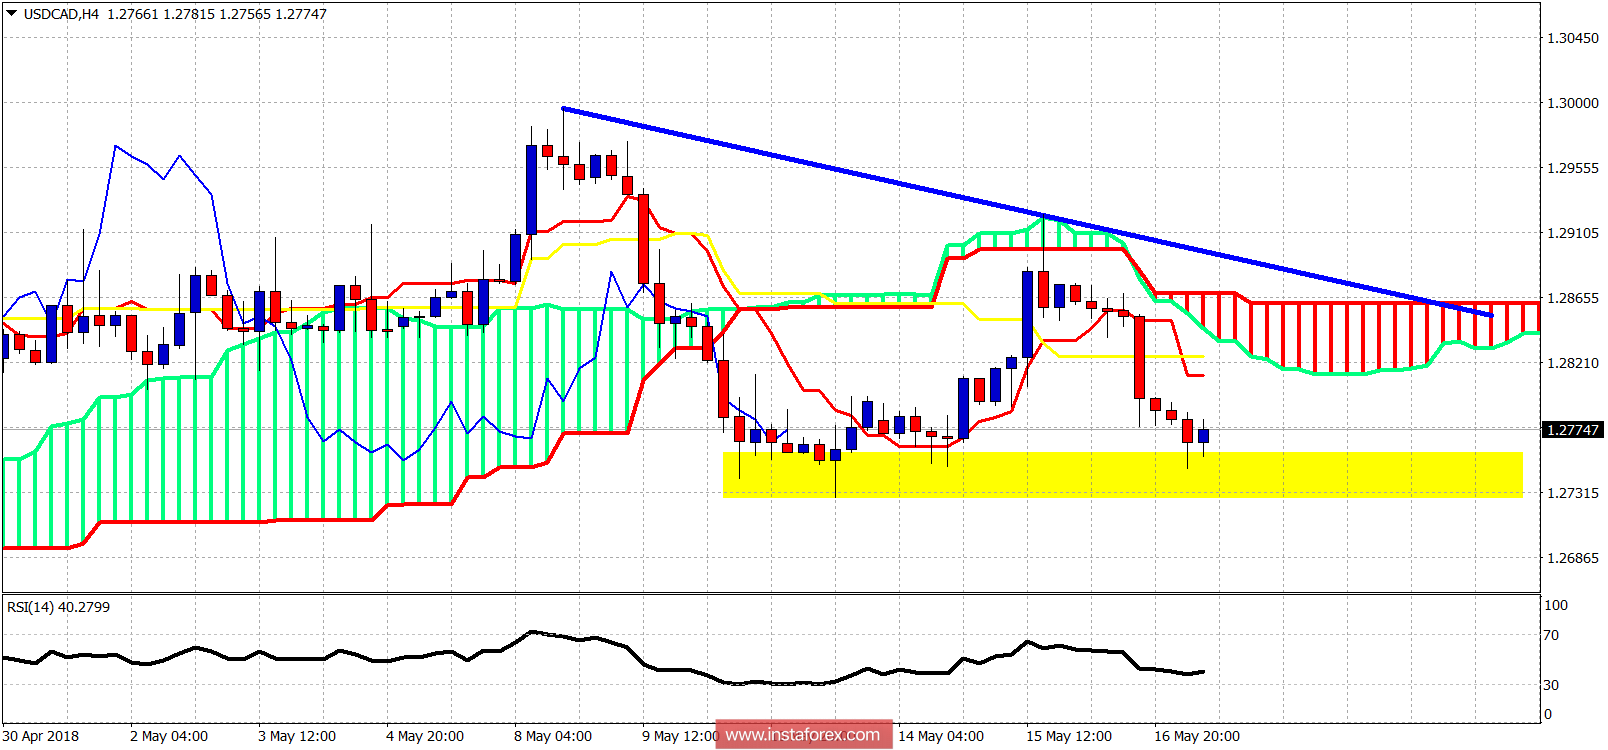
Blue line - resistance trend line
Yellow rectangle - support area
The USD/CAD pair is trading below the 4-hour cloud. However we have critical short-term support at 1.2730-1.2750. A break below this area will open the way for a move lower towards 1.2650. Bulls need to see a bounce from this area and a break above the short-term resistance of 1.2830. Cloud resistance is at 1.2830 until 1.2870. Breaking above the blue trend line and above the cloud are the signs bulls want to see in order to control the trend. Until then bears are under control of the trend and I remain bearish.