 English
  Русский
 Bahasa Indonesia
 Bahasa Malay
 ไทย
ไทย Español
 Deutsch
 Български
 Français
 Tiếng Việt
 中文
中文 বাংলা
বাংলা हिन्दी
 Čeština
 Українська
 Română

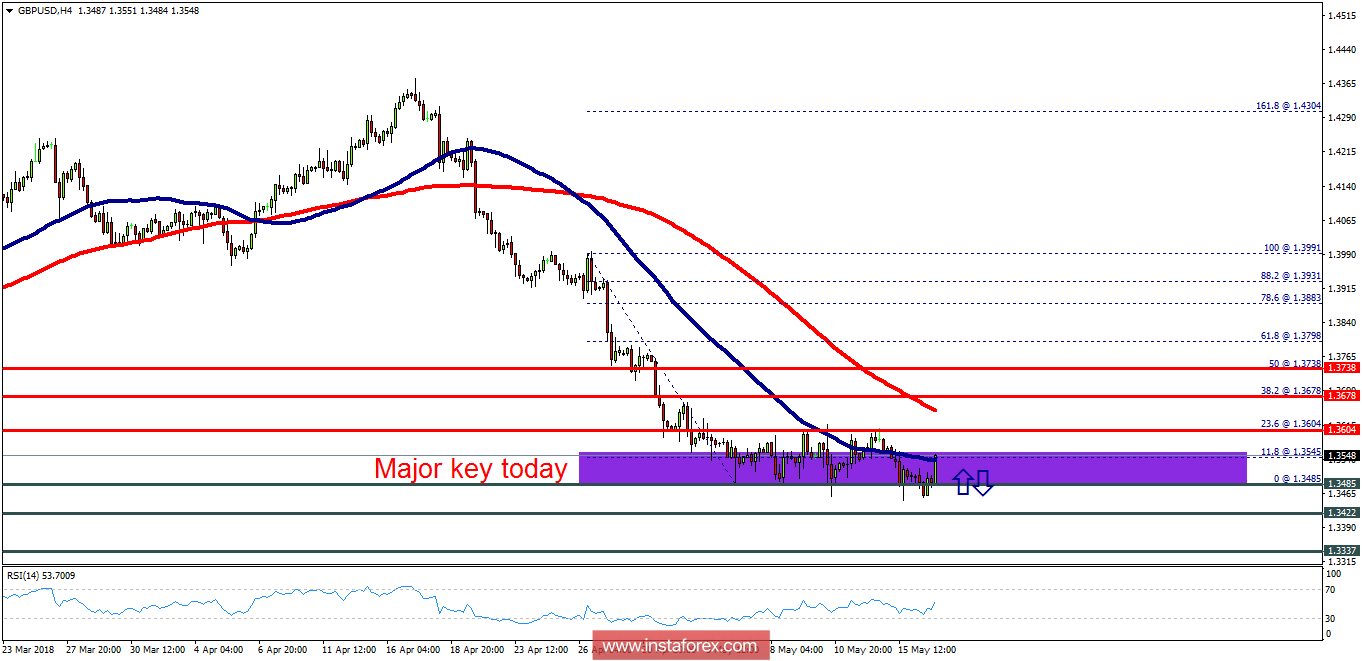
Overview:
The GBP/USD pair is still moving around the area of 1.3534 - 1.3485 this week. Today, the level of 1.3485 represents a daily support in the H1 time frame. The pair has already formed the minor resistance at 1.3604 and the strong resistance is seen at the level of 1.3678, as it represents the weekly resistance 1. So, the major resistance is seen at 1.3678, while immediate support is found at 1.3485. If the pair closes below the weekly pivot point of 1.3534, the GBP/USD pair may resume its movement to 1.3485 to test the weekly support 1. From this point, we expect the GBP/USD pair to move between the levels of 1.3534 and 1.3485. Equally important, the RSI is still calling for a strong bearish market and the current price is below the moving average 100. As a result, sell below the level of 1.3485 with targets at 1.3422 and 1.3337 in order to form a new double bottom. However, stop loss should always be taken into account; accordingly, it will be beneficial to set the stop loss order above the last bullish wave at the level of 1.3678.