 English
  Русский
 Bahasa Indonesia
 Bahasa Malay
 ไทย
ไทย Español
 Deutsch
 Български
 Français
 Tiếng Việt
 中文
中文 বাংলা
বাংলা हिन्दी
 Čeština
 Українська
 Română

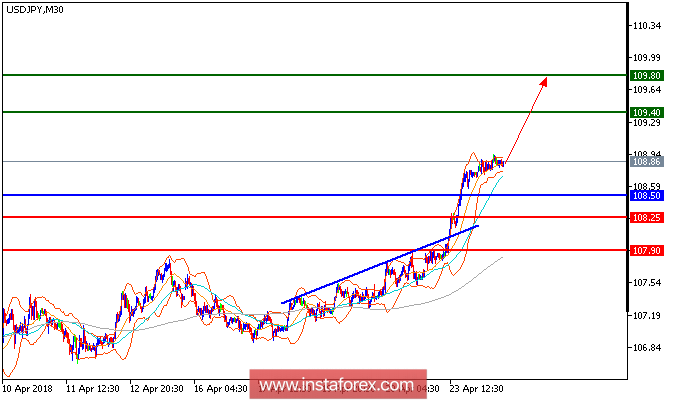
All our upside target which we predicted in the previous analysis have been hit. USD/JPY is still expected to trade with bullish outlook. The pair accelerated on the upside after breaking above the upper boundary of the rising channel. Both rising 20-period and 50-period moving averages play support roles. The relative strength index shows upward momentum. Hence, as long as 108.50 is not broken, look for a further advance with targets at 109.40 and 109.80 in extension.
Chart Explanation: The black line shows the pivot point. The present price above the pivot point indicates a bullish position, and the price below the pivot point indicates a short position. The red lines show the support levels, and the green line indicates the resistance levels. These levels can be used to enter and exit trades.
Strategy: BUY, stop loss at 108.50, take profit at 109.40.
Resistance levels: 109.40, 109.80, and 110.15
Support levels: 108.25, 107.90, and 107.50.