 English
  Русский
 Bahasa Indonesia
 Bahasa Malay
 ไทย
ไทย Español
 Deutsch
 Български
 Français
 Tiếng Việt
 中文
中文 বাংলা
বাংলা हिन्दी
 Čeština
 Українська
 Română

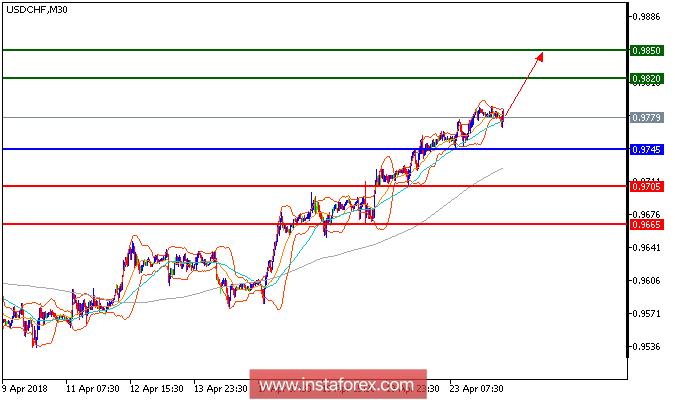
USD/CHF is expected to trade with bullish outlook. The pair remains bullish above its horizontal support at 0.9745, and is likely to challenge the next resistance at 0.9820. The relative strength index is also positive above its neutrality area at 50. In addition, the rising 50-period moving average plays a support role, and should continue to push the prices higher to 0.9820 and 0.9850 in extension.
Chart Explanation: The black line shows the pivot point. The present price above the pivot point indicates a bullish position, and the price below the pivot point indicates a short position. The red lines show the support levels, and the green line indicates the resistance levels. These levels can be used to enter and exit trades.
Strategy: BUY, stop loss at 0.9745, take profit at 0.9820.
Resistance levels: 0.9820, 0.9850, and 0.9885
Support levels: 0.9705, 0.9665, and 0.9620.