 English
  Русский
 Bahasa Indonesia
 Bahasa Malay
 ไทย
ไทย Español
 Deutsch
 Български
 Français
 Tiếng Việt
 中文
中文 বাংলা
বাংলা हिन्दी
 Čeština
 Українська
 Română

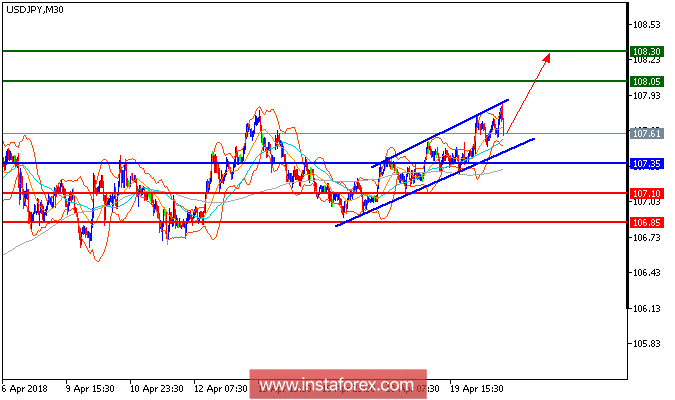
All our targets which we predicted in the previous analysis have been hit. USD/JPY is still trading higher and expected to continue moving higher. The pair keeps trading on the upside repeatedly striking the upper Bollinger band. Upward momentum is also evidenced by the relative strength index, which is well directed in the 60s. Meanwhile, the key support at 107.15 remains intact maintaining the intraday outlook bullish. Therefore, the pair is expected to be on track to reach upside target at 108.05 and 108.30.
Chart Explanation: The black line shows the pivot point. The present price above the pivot point indicates a bullish position, and the price below the pivot point indicates a short position. The red lines show the support levels, and the green line indicates the resistance levels. These levels can be used to enter and exit trades.
Strategy: BUY, stop loss at 107.35, take profit at 108.05.
Resistance levels: 108.05, 108.30, and 108.65
Support levels: 107.10, 106.85, and 106.55.