 English
  Русский
 Bahasa Indonesia
 Bahasa Malay
 ไทย
ไทย Español
 Deutsch
 Български
 Français
 Tiếng Việt
 中文
中文 বাংলা
বাংলা हिन्दी
 Čeština
 Українська
 Română

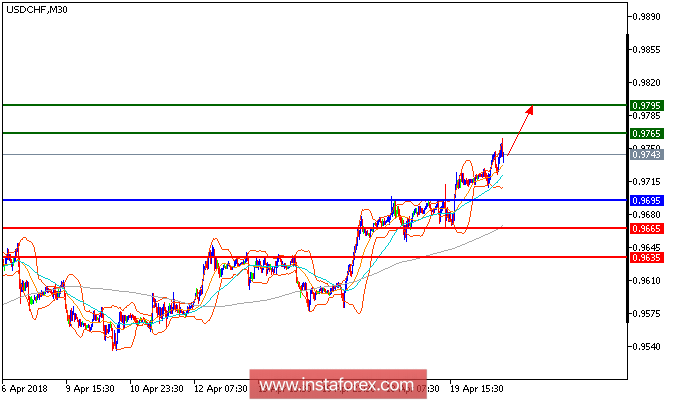
All our targets which we predicted in previous analysis have been hit, USD/CHF is still trading highe and expected to trade with a bullish outlook. The pair is trading above its rising 20-period and 50-period moving averages, which play support roles and maintain the upside bias. The relative strength index lacks downward momentum. The downside potential should be limited by the key support at 0.9695. Therefore, as long as this key level is not broken, look for a new challenge with targets at 0.9765 and 0.9795 in extension.
Chart Explanation: The black line shows the pivot point. The present price above the pivot point indicates a bullish position, and the price below the pivot point indicates a short position. The red lines show the support levels, and the green line indicates the resistance levels. These levels can be used to enter and exit trades.
Strategy: BUY, stop loss at 0.9695, take profit at 0.9765.
Resistance levels: 0.9765, 0.9795, and 0.9835
Support levels: 0.9665, 0.9635, and 0.9600.