 English
  Русский
 Bahasa Indonesia
 Bahasa Malay
 ไทย
ไทย Español
 Deutsch
 Български
 Français
 Tiếng Việt
 中文
中文 বাংলা
বাংলা हिन्दी
 Čeština
 Українська
 Română

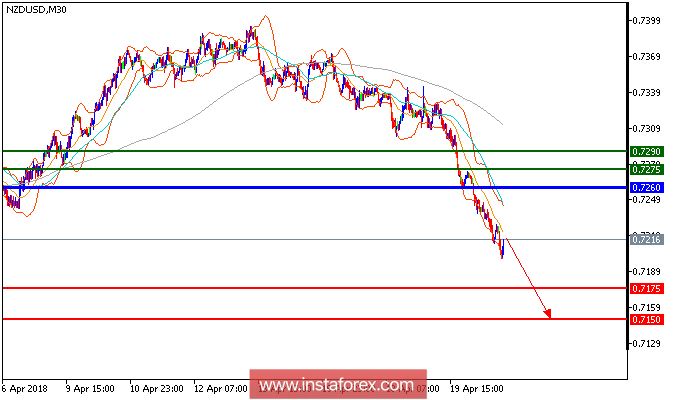
All our targets which we predicted in yesterday's analysis have been hit, NZD/USD is still under pressure and expected to continue its downside movement. The pair accelerated on the downside along the lower boundary of Bollinger Bands. The downward momentum is further reinforced by both declining 20-period and 50-period moving averages. The relative strength index has broken down its oversold level at 30. Hence, below 0.7260, look for a further drop with targets at 0.7175 and 0.7150 in extension.
Chart Explanation: The black line shows the pivot point. Currently, the price is above the pivot point, which is a signal for long positions. If it remains below the pivot point, it will indicate short positions. The red lines show the support levels, while the green line indicates the resistance levels. These levels can be used to enter and exit trades.
Resistance levels: 0.7275, 0.7290, and 0.7335
Support levels: 0.7175, 0.7150, and 0.7100.