 English
  Русский
 Bahasa Indonesia
 Bahasa Malay
 ไทย
ไทย Español
 Deutsch
 Български
 Français
 Tiếng Việt
 中文
中文 বাংলা
বাংলা हिन्दी
 Čeština
 Українська
 Română

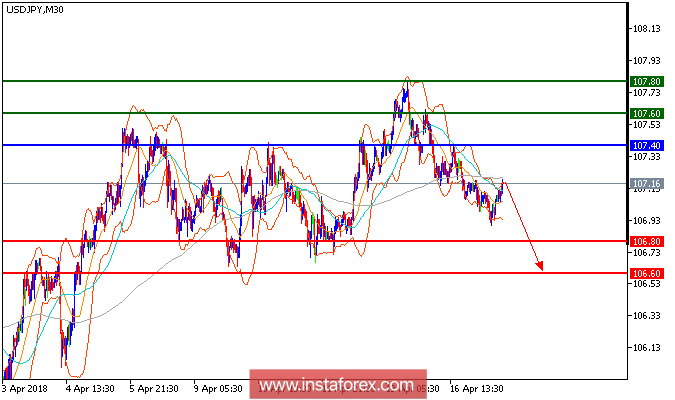
USD/JPY is expected to trade with a bearish outlook. The pair is trading within a bearish channel drawn from last Friday (April 13). It is currently testing the key level of 107.00 on the downside, as the 20-period and 50-period moving averages are badly oriented. The relative strength index remains subdued in the 30s, suggesting a lack of upward momentum for the pair. Below 107.40, the next support (downside target) at 106.80 would come into sight.
Chart Explanation: The black line shows the pivot point. The present price above the pivot point indicates a bullish position, and the price below the pivot point indicates a short position. The red lines show the support levels, and the green line indicates the resistance levels. These levels can be used to enter and exit trades.
Strategy: SELL, stop loss at 107.40, take profit at 106.80.
Resistance levels: 107.60, 107.80, and 108.20
Support levels: 106.80, 106.60, and 106.20.