 English
  Русский
 Bahasa Indonesia
 Bahasa Malay
 ไทย
ไทย Español
 Deutsch
 Български
 Français
 Tiếng Việt
 中文
中文 বাংলা
বাংলা हिन्दी
 Čeština
 Українська
 Română

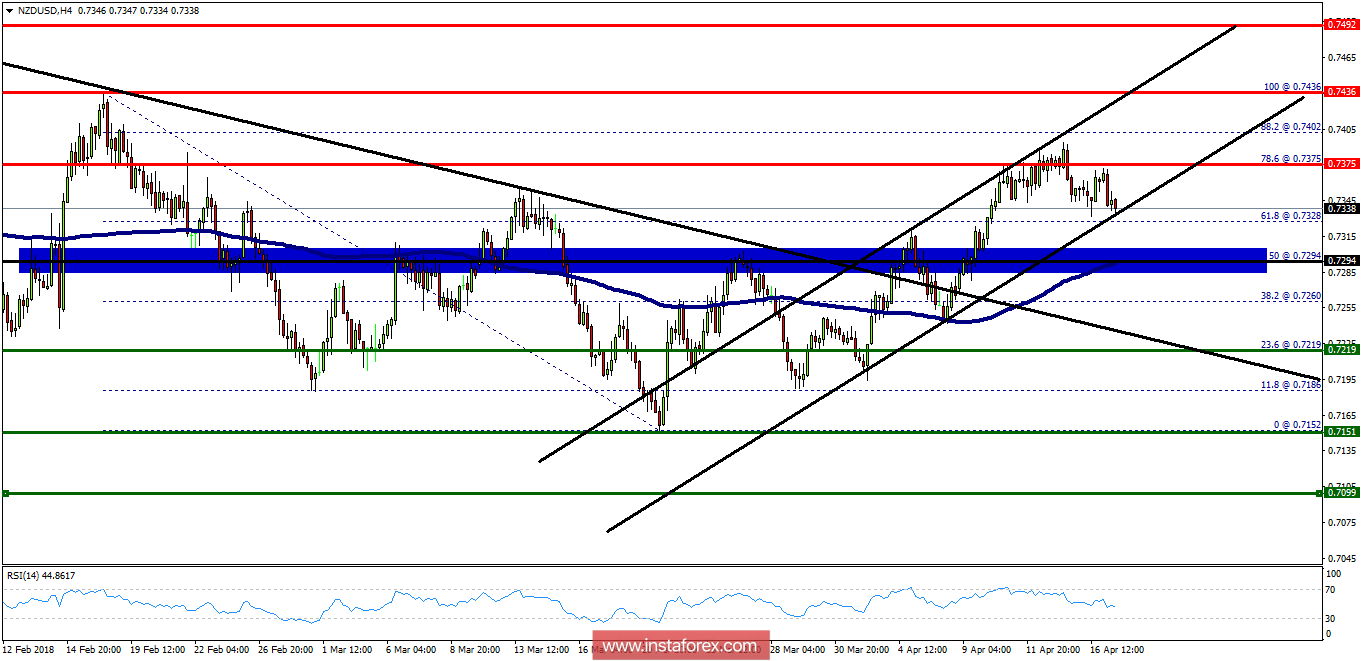
The pivot point is seen at the point of 0.7294.
The NZD/USD pair is still continuing to move upwards from the level of 0.7294 and 0.7436. The level of 0.7294 represents the daily pivot point in the H4 time frame. The pair rose from the level of 0.7294 to a top around 0.7375.
Right now, the price is moving around the level of 0.7375. Also, it should be noted that the resistances levels are lies in 0.7375 and 0.7436, while daily support 1 is seen at 0.7294 (50% Fibonacci retracement).
According to the previous events, the NZD/USD pair is still moving between the levels of 0.7294 and 0.7436; so we expect a range of 142 pips. Furthermore, if the trend is able to break out through the first resistance level at 0.7375, we should see the pair climbing towards the double top (0.7436) to test it.
Therefore, buy above the level of 0.7300 with the first target at 0.7375 in order to test the daily resistance 1 and further to 0.7436. Also, it might be noted that the level of 0.7436 is a good place to take profit because it will form a double top.
On the other hand, in case a reversal takes place and the NZD/USD pair breaks through the support level of 0.7294, a further decline to 0.7151 can occur which would indicate a bearish market.