 English
  Русский
 Bahasa Indonesia
 Bahasa Malay
 ไทย
ไทย Español
 Deutsch
 Български
 Français
 Tiếng Việt
 中文
中文 বাংলা
বাংলা हिन्दी
 Čeština
 Українська
 Română

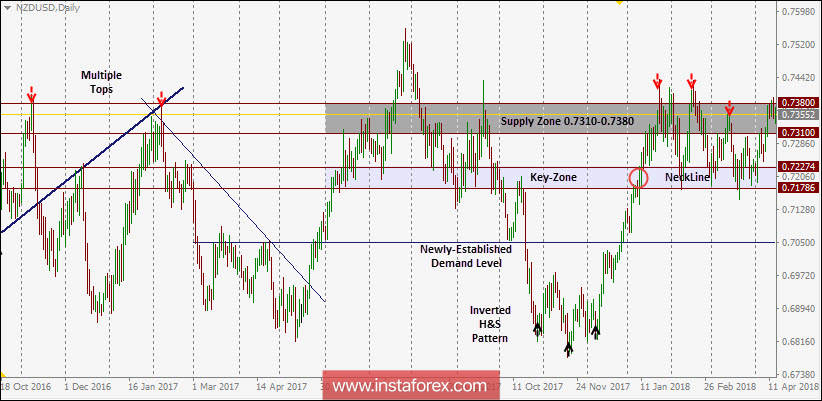
In November 2017, evident signs of bullish recovery were expressed around the depicted low (0.6780). An inverted Head and Shoulders pattern was expressed around these price levels.
The price zone of 0.7140-0.7250 (prominent Supply-Zone) failed to pause the ongoing bullish momentum. Instead, a bullish breakout above 0.7250 was expressed on January 11.
That's why a quick bullish movement was expected towards the depicted supply zone (0.7320-0.7390) where evident bearish rejection and a valid SELL entry were expected.
On February 2, a bearish engulfing daily candlestick was expressed off the price level of 0.7390.
Moreover, a double-top reversal pattern followed by another lower High were expressed around the price zone (0.7320-0.7390) where a valid SELL entry was offered as expected.
In general, the NZD/USD pair remains trapped between the price levels of 0.7200 and 0.7350 until the bearish breakdown of 0.7200 occurs.
The price zone of 0.7320-0.7390 remains a significant supply zone to offer a valid SELL entry during the current bullish pullback. A bullish breakout above 0.7450 invalidates this bearish scenario.
On the other hand, a bearish breakdown of 0.7200 (neckline) is needed to confirm the depicted reversal pattern. Bearish projection target would be located around 0.7050 and 0.7000.