 English
  Русский
 Bahasa Indonesia
 Bahasa Malay
 ไทย
ไทย Español
 Deutsch
 Български
 Français
 Tiếng Việt
 中文
中文 বাংলা
বাংলা हिन्दी
 Čeština
 Українська
 Română

The index remains in a bearish structure after having found dynamic resistance in the 200 SMA at H1 chart and such move is helping to add pressure to the support level of 89.36. If that level gives up, then a lower continuation to test the support zone of 87.88 is a possibility. However, rebounds at the current place should be limited by the 200 SMA.
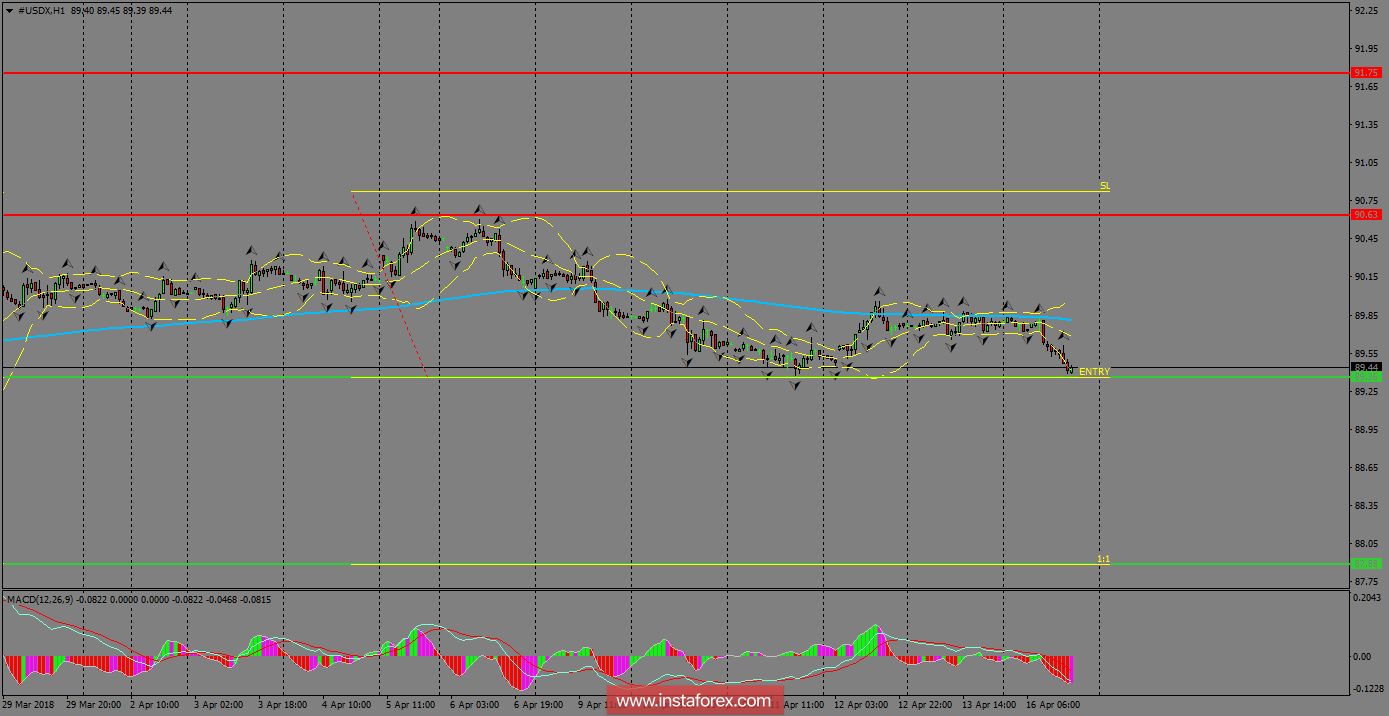
H1 chart's resistance levels: 90.63 / 91.75
H1 chart's support levels: 89.36 / 87.88
Trading recommendations for today: Based on the H1 chart, place sell (short) orders only if the USD Index breaks with a bearish candlestick; the support level is at 89.36, take profit is at 87.88 and stop loss is at 90.81.