 English
  Русский
 Bahasa Indonesia
 Bahasa Malay
 ไทย
ไทย Español
 Deutsch
 Български
 Français
 Tiếng Việt
 中文
中文 বাংলা
বাংলা हिन्दी
 Čeština
 Українська
 Română

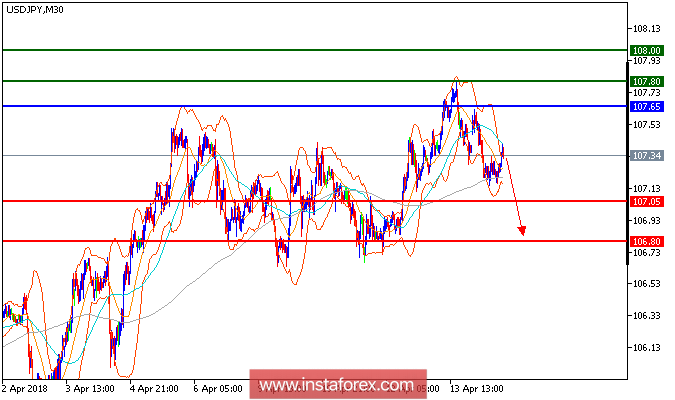
USD/JPY is expected to trade with bearish outlook. The pair has returned to levels above both the 20-period and 50-period moving averages, but remains capped by the key resistance at 107.65. Meanwhile, the relative strength index has returned to levels above the neutrality level of 50, indicating that upward momentum could push the pair higher. As long as the key resistance at 107.65 is not surpassed, intraday bearishness persists, and the pair could pull back to 107.05 on the downside.
Chart Explanation: The black line shows the pivot point. The present price above the pivot point indicates a bullish position, and the price below the pivot point indicates a short position. The red lines show the support levels, and the green line indicates the resistance levels. These levels can be used to enter and exit trades.
Strategy: SELL, stop loss at 107.65, take profit at 107.05.
Resistance levels: 107.80, 108, and 108.50
Support levels: 107.05, 106.80, and 106.50.