 English
  Русский
 Bahasa Indonesia
 Bahasa Malay
 ไทย
ไทย Español
 Deutsch
 Български
 Français
 Tiếng Việt
 中文
中文 বাংলা
বাংলা हिन्दी
 Čeština
 Українська
 Română

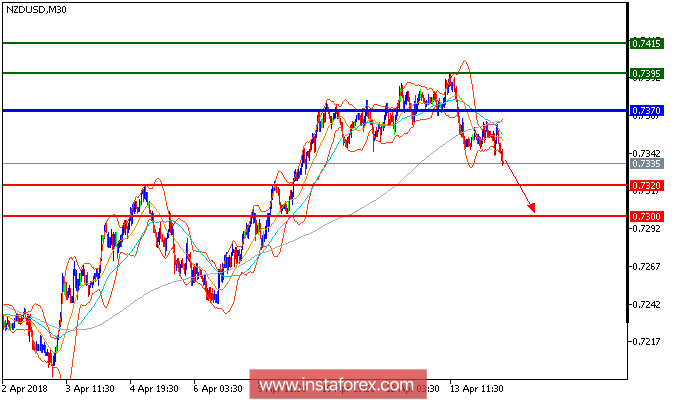
NZD/USD is expected to trade with a bullish outlook. The pair retreated from 0.7395 (the high of April 13) and broke below its rising trend line since April 11, which confirmed a bearish outlook. The declining 50-period moving average is acting as a resistance. The relative strength index is mixed with bearish bias. Hence, as long as 0.7370 is not surpassed, look for a drop with targets at 0.7320 and 0.7300 in extension.
Chart Explanation: The black line shows the pivot point. Currently, the price is above the pivot point which is a signal for long positions. If it remains below the pivot point, it will indicate short positions. The red lines show the support levels, while the green line indicates the resistance levels. These levels can be used to enter and exit trades.
Resistance levels: 0.7395, 0.7415, and 0.7450
Support levels: 0.7320, 0.7300, and 0.7265.