 English
  Русский
 Bahasa Indonesia
 Bahasa Malay
 ไทย
ไทย Español
 Deutsch
 Български
 Français
 Tiếng Việt
 中文
中文 বাংলা
বাংলা हिन्दी
 Čeština
 Українська
 Română

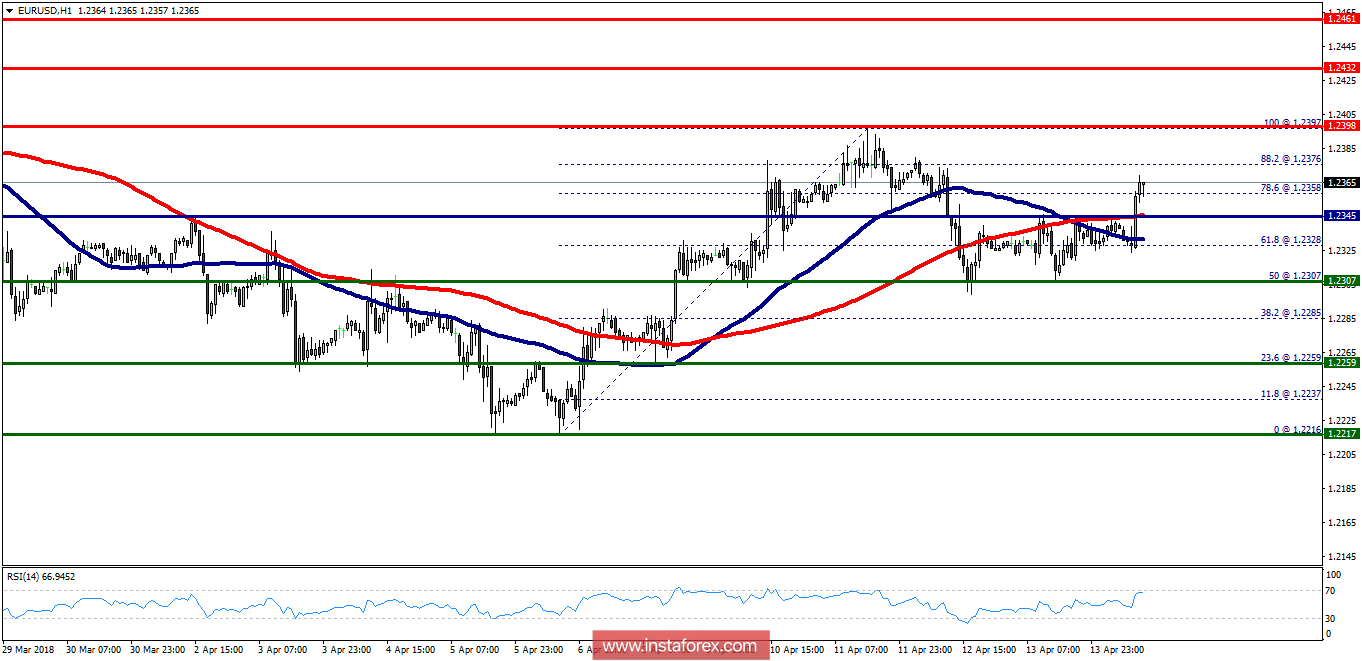
The EUR/USD pair will probably continue to rise from the level of 1.2345 in the long term. It should be noted that the support is established at the level of 1.2307 which represents the 50% Fibonacci retracement level on the H1 chart. The price is likely to form a double bottom in the same time frame. Accordingly, the EUR/USD pair is showing signs of strength following a breakout of the highest level of 1.2345. So, buy above the level of 1.2345 with the first target at 1.2398 in order to test the daily resistance 1 and further to 1.2432. Also, it might be noted that the level of 1.2432 is a good place to take profit because it will form a new double top. On the other hand, in case a reversal takes place and the EUR/USD pair breaks through the support level of 1.2307, a further decline to 1.2217 can occur which would indicate a bearish market.