 English
  Русский
 Bahasa Indonesia
 Bahasa Malay
 ไทย
ไทย Español
 Deutsch
 Български
 Français
 Tiếng Việt
 中文
中文 বাংলা
বাংলা हिन्दी
 Čeština
 Українська
 Română

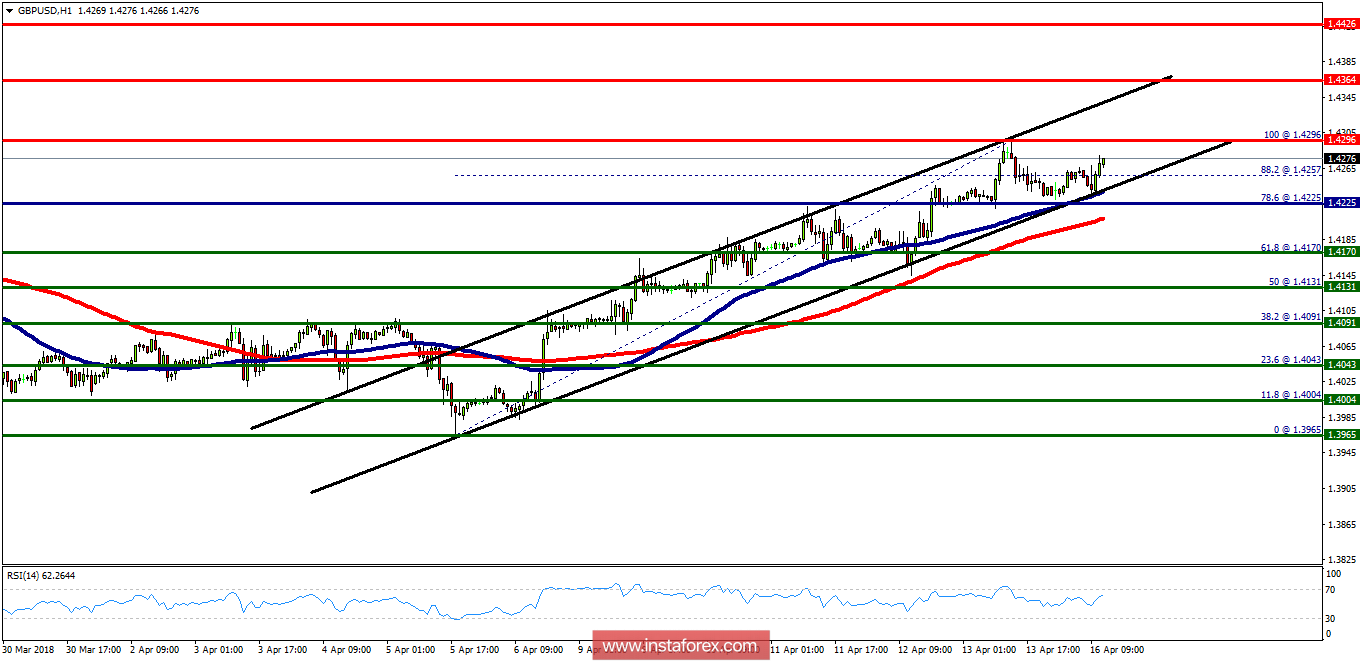
The GBP/USD pair continues to trade upwards from the level of 1.4225 (the daily pivot point). Last week, the pair rose from the level of 1.4170 (the level of 1.4170 is coincided with the major support today) to the top around 1.4296. Today, the first resistance level is seen at 1.4364 followed by 1.4426, while daily support 1 is seen at 1.4170. According to the previous events, the GBP/USD pair is still moving between the levels of 1.4225 and 1.4364; for that we expect a range of 139 pips (1.4364 - 1.4225) at least in coming days. If the GBP/USD pair fails to break through the resistance level of 1.4364, the market will decline further to 1.4170. This would suggest a bearish market because the RSI indicator is still in a positive area and does not show any trend-reversal signs. The pair is expected to drop lower towards 1.4170 with a view to test the daily support. On the contrary, if a breakout takes place at the resistance level of 1.4364, then the trend will continue to move towards the next target of 1.4426.