 English
  Русский
 Bahasa Indonesia
 Bahasa Malay
 ไทย
ไทย Español
 Deutsch
 Български
 Français
 Tiếng Việt
 中文
中文 বাংলা
বাংলা हिन्दी
 Čeština
 Українська
 Română

The Gold price continues to trade inside the $1,360-$1,300 range. The price is near the upper boundary and below resistance. There is a danger of seeing a push lower towards $1,300 as long as we remain below $1,350.
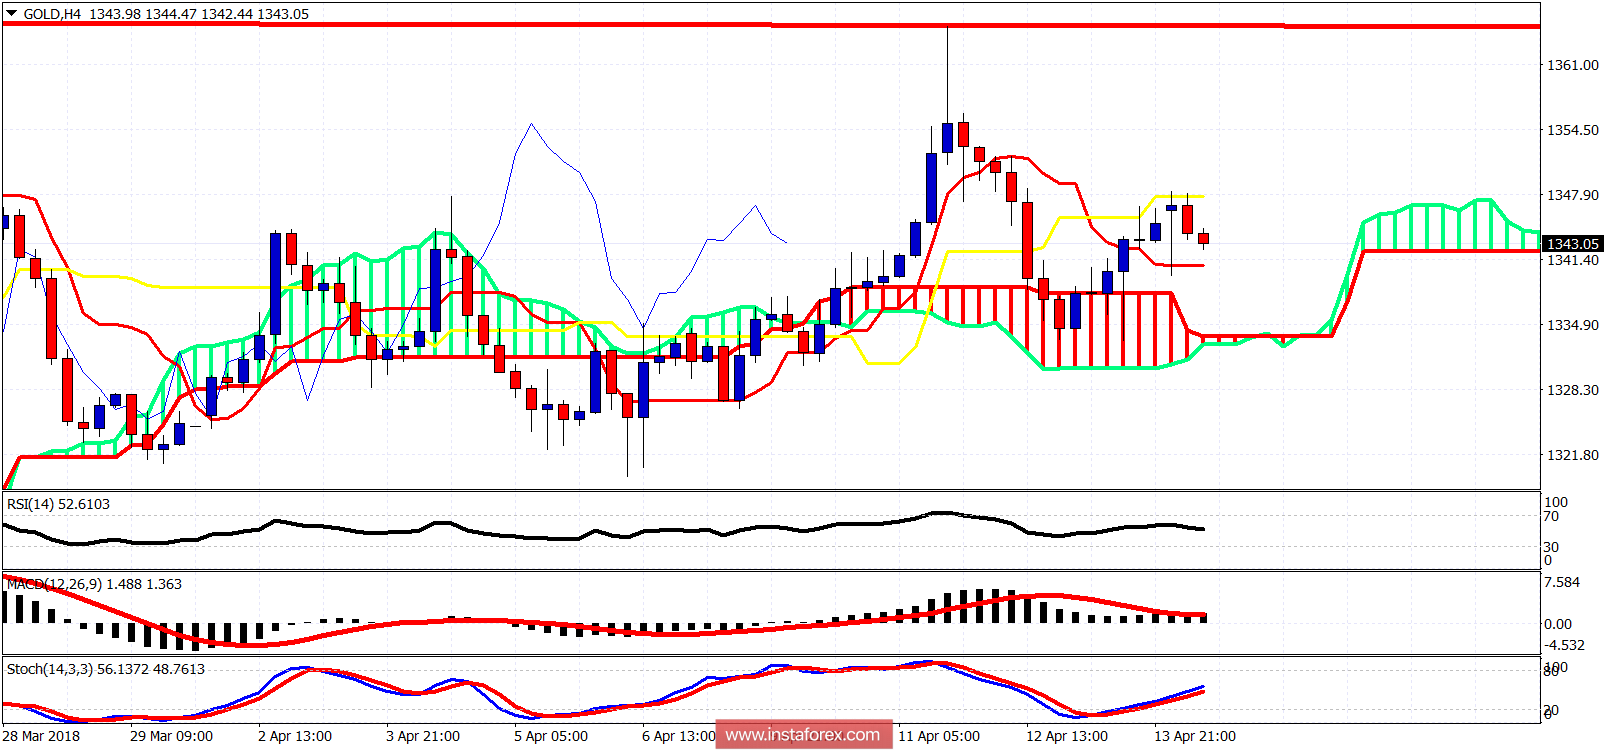
Magenta line - long-term resistance
Black line - short-term support
The Gold price is in a bullish trend as long as the price is above the Ichimoku cloud. However, the price remains in a sideways neutral trend for the last few weeks as the price is trapped between $1,365 and $1,300. Last weeks rejection and reversal at $1,365 was not a good sign. However, bulls have hopes of retesting this level as long as they remain above $1,340-33 area. Break this support and we go to $1,320-$1,300 area. Break above $1,350-65 area and we go to $1,400-$1,450.