 English
  Русский
 Bahasa Indonesia
 Bahasa Malay
 ไทย
ไทย Español
 Deutsch
 Български
 Français
 Tiếng Việt
 中文
中文 বাংলা
বাংলা हिन्दी
 Čeština
 Українська
 Română

USDX kept its neutral stance around the 200 SMA at H1 chart, which is helping to cap further gains in the index for the short-term. We're still expecting a pullback to take place in order to break below 89.36, which should be a move that resumes the overall bearish structure seen in the greenback. MACD indicator is entering the negative territory, favoring to the bears.
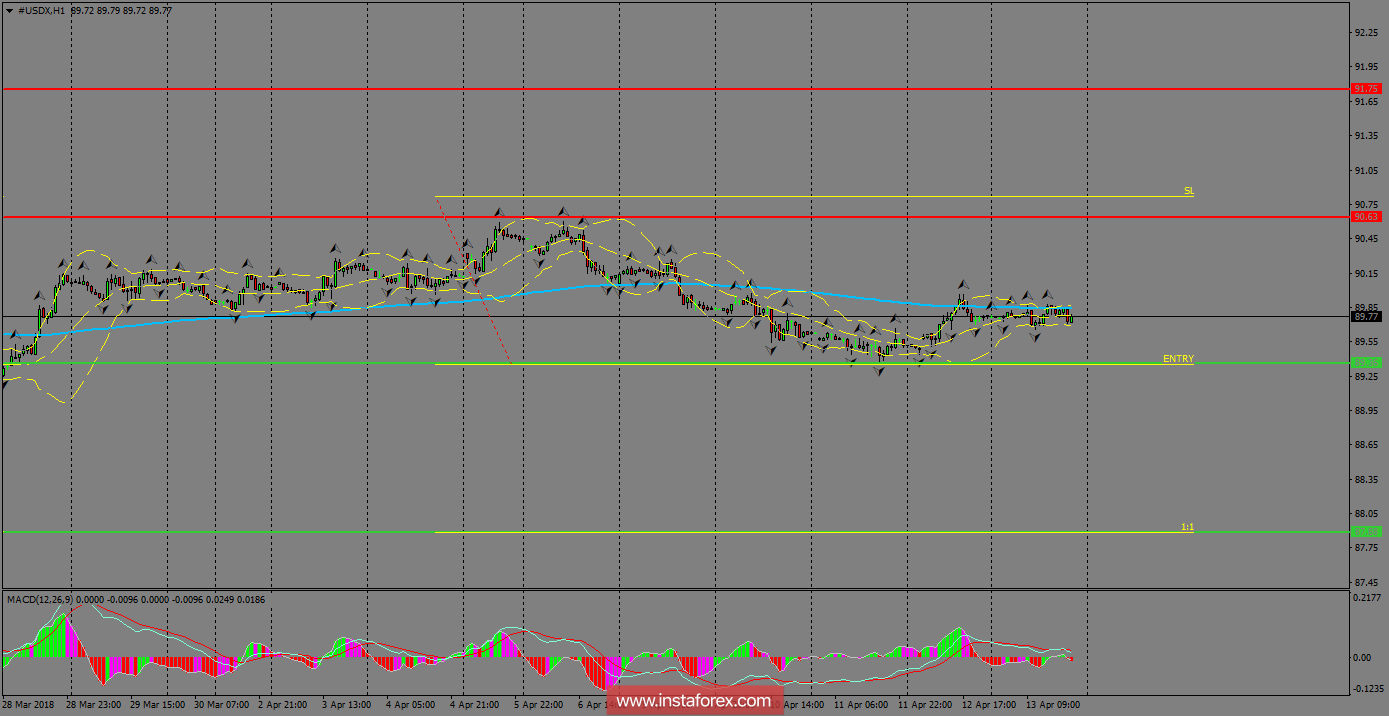
H1 chart's resistance levels: 90.63 / 91.75
H1 chart's support levels: 89.36 / 87.88
Trading recommendations for today: Based on the H1 chart, place sell (short) orders only if the USD Index breaks with a bearish candlestick; the support level is at 89.36, take profit is at 87.88 and stop loss is at 90.81.