 English
  Русский
 Bahasa Indonesia
 Bahasa Malay
 ไทย
ไทย Español
 Deutsch
 Български
 Français
 Tiếng Việt
 中文
中文 বাংলা
বাংলা हिन्दी
 Čeština
 Українська
 Română

GBP/USD continues with the bullish bias across the board, as it managed to break above 1.4205, which was a key level for the bulls. The nearest resistance lies at 1.4283, where the pair should work with a breakout in order to allow additional gains toward the next key barrier at 1.4386. The 200 SMA at H1 chart remains to guide the path for the short-term.
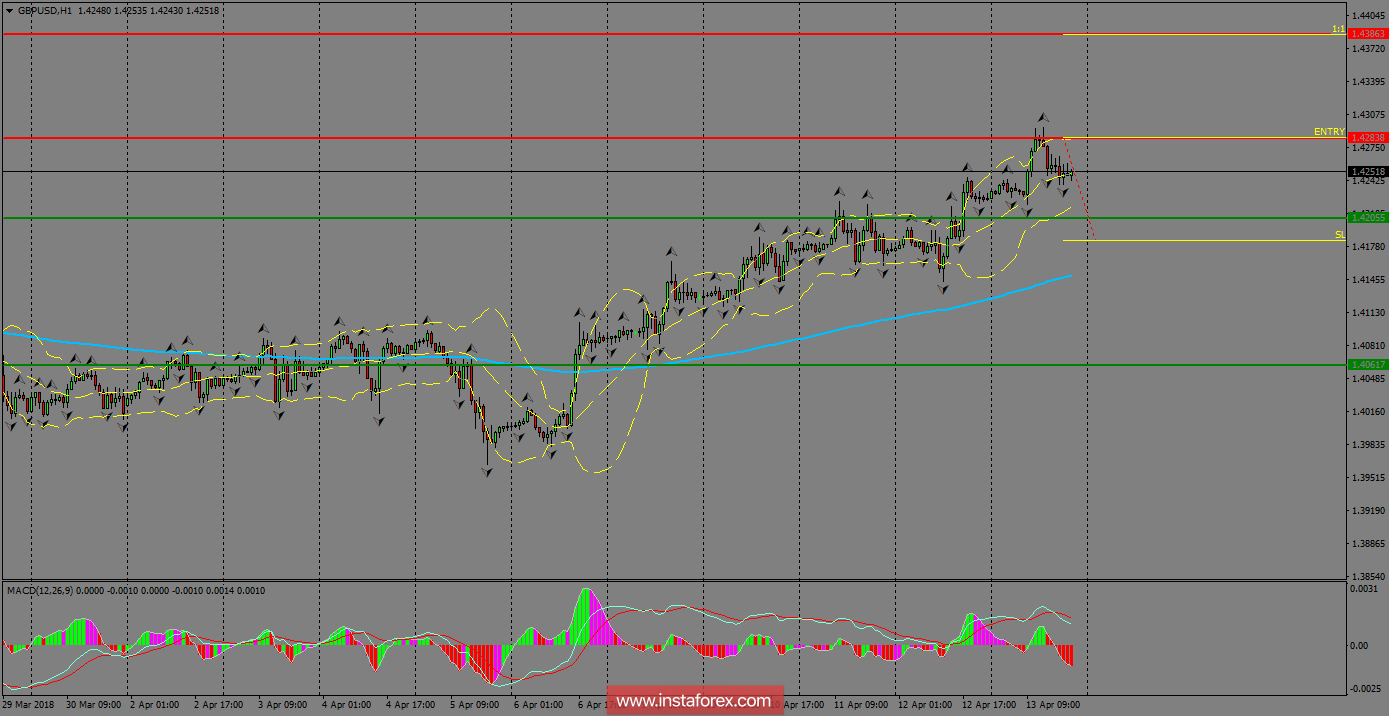
H1 chart's resistance levels: 1.4283 / 1.4386
H1 chart's support levels: 1.4205 / 1.4061
Trading recommendations for today: Based on the H1 chart, buy (long) orders only if the GBP/USD pair breaks a bullish candlestick; the resistance level is at 1.4283, take profit is at 1.4386 and stop loss is at 1.4183.