 English
  Русский
 Bahasa Indonesia
 Bahasa Malay
 ไทย
ไทย Español
 Deutsch
 Български
 Français
 Tiếng Việt
 中文
中文 বাংলা
বাংলা हिन्दी
 Čeština
 Українська
 Română

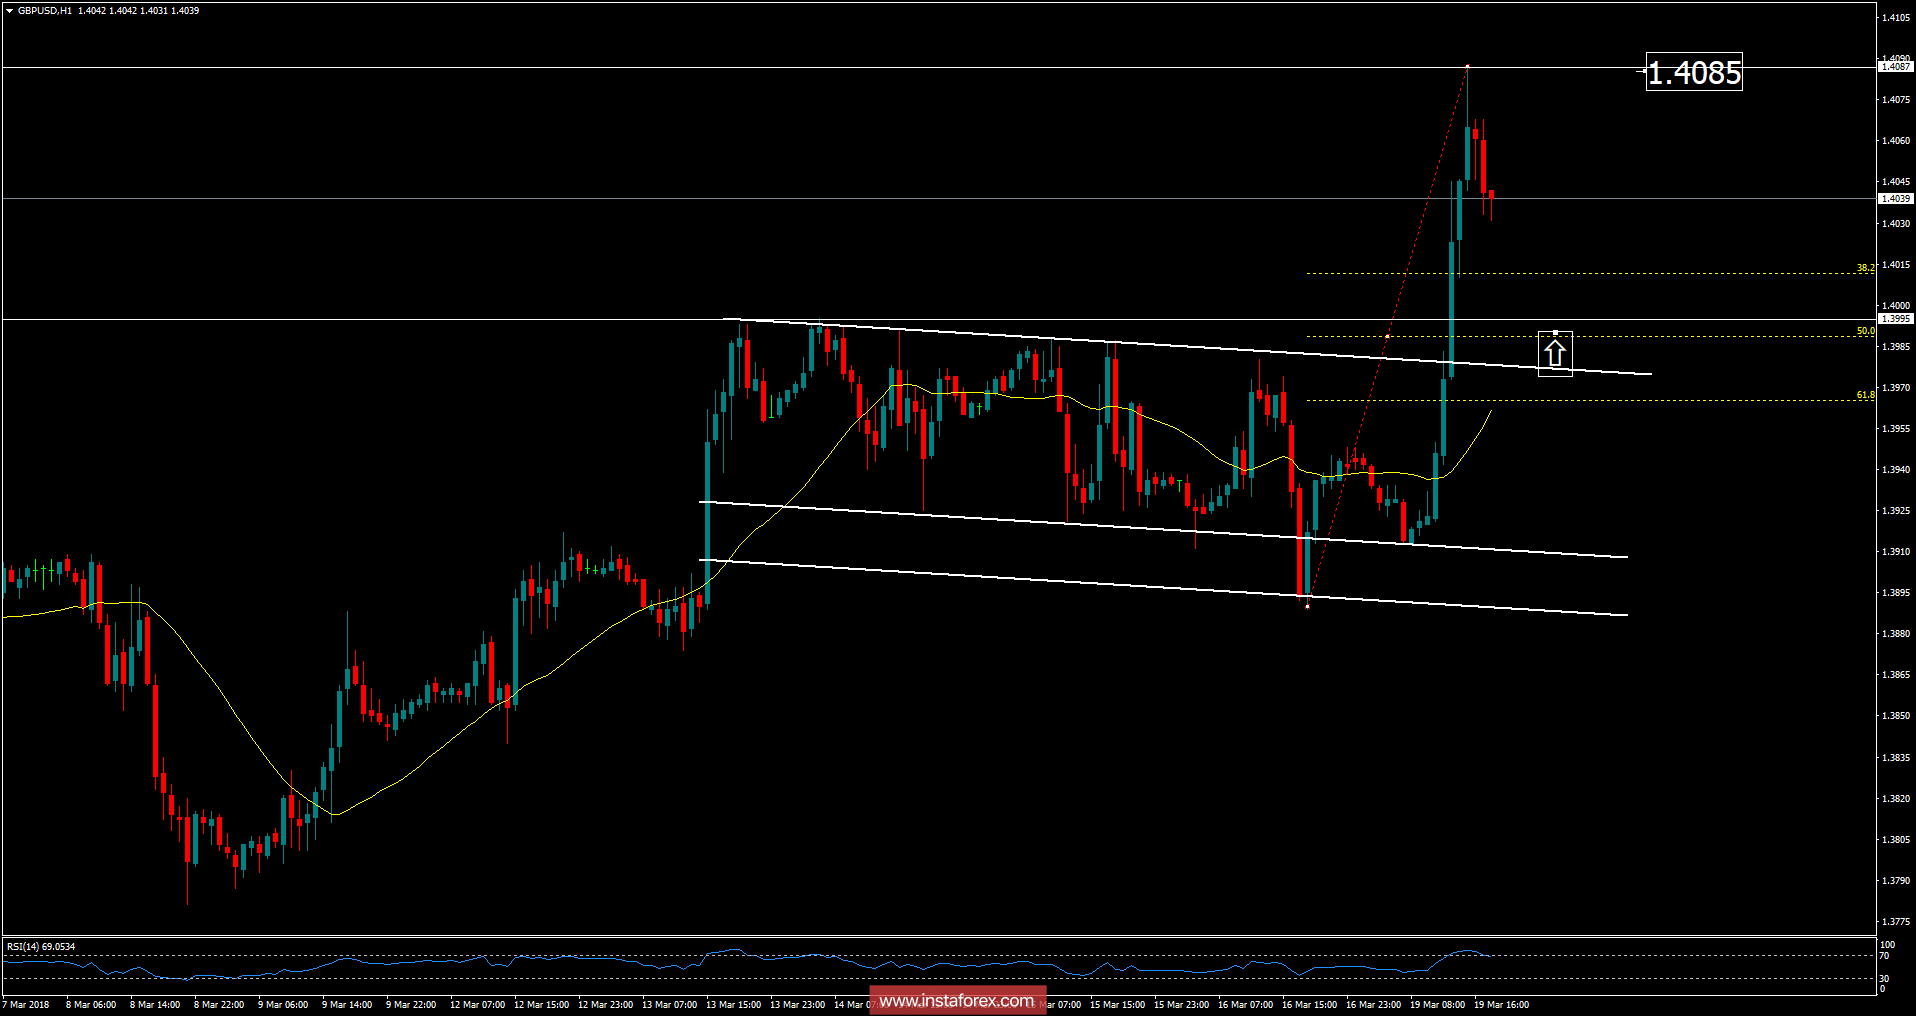
Recently, the GBP/USD pair has been trading upwards. The price tested the level of 1.4087. Anyway, according to the 1H time frame, I found that GBP/USD entered a potential corrective phase and my advice is to watch for buying opportunities on the dips. I have placed Fibonacci retracement to find potential levels for long positions and I got Fibonacci retracement 38.2% at the price of 1.4012, Fibonacci retracement 50% at the price of 1.3993 and Fibonacci retracement 61.8% at the price of 1.3965. The upward target is set at the price of 1.4085.
Resistance levels:
R1: 1.3986
R2: 1.4030
R3: 1.4075
Support levels:
S1: 1.3895
S2: 1.3847
S3: 1.3805
Trading recommendations for today: watch for potential buying opportunities on the dips.