 English
  Русский
 Bahasa Indonesia
 Bahasa Malay
 ไทย
ไทย Español
 Deutsch
 Български
 Français
 Tiếng Việt
 中文
中文 বাংলা
বাংলা हिन्दी
 Čeština
 Українська
 Română

The Gold price remains inside the trading range of $1,300-$1,350. Price is moving above and below the 4-hour cloud for the last couple of weeks. There is no clear trend. This is better depicted in the Daily chart as price remains inside the cloud.
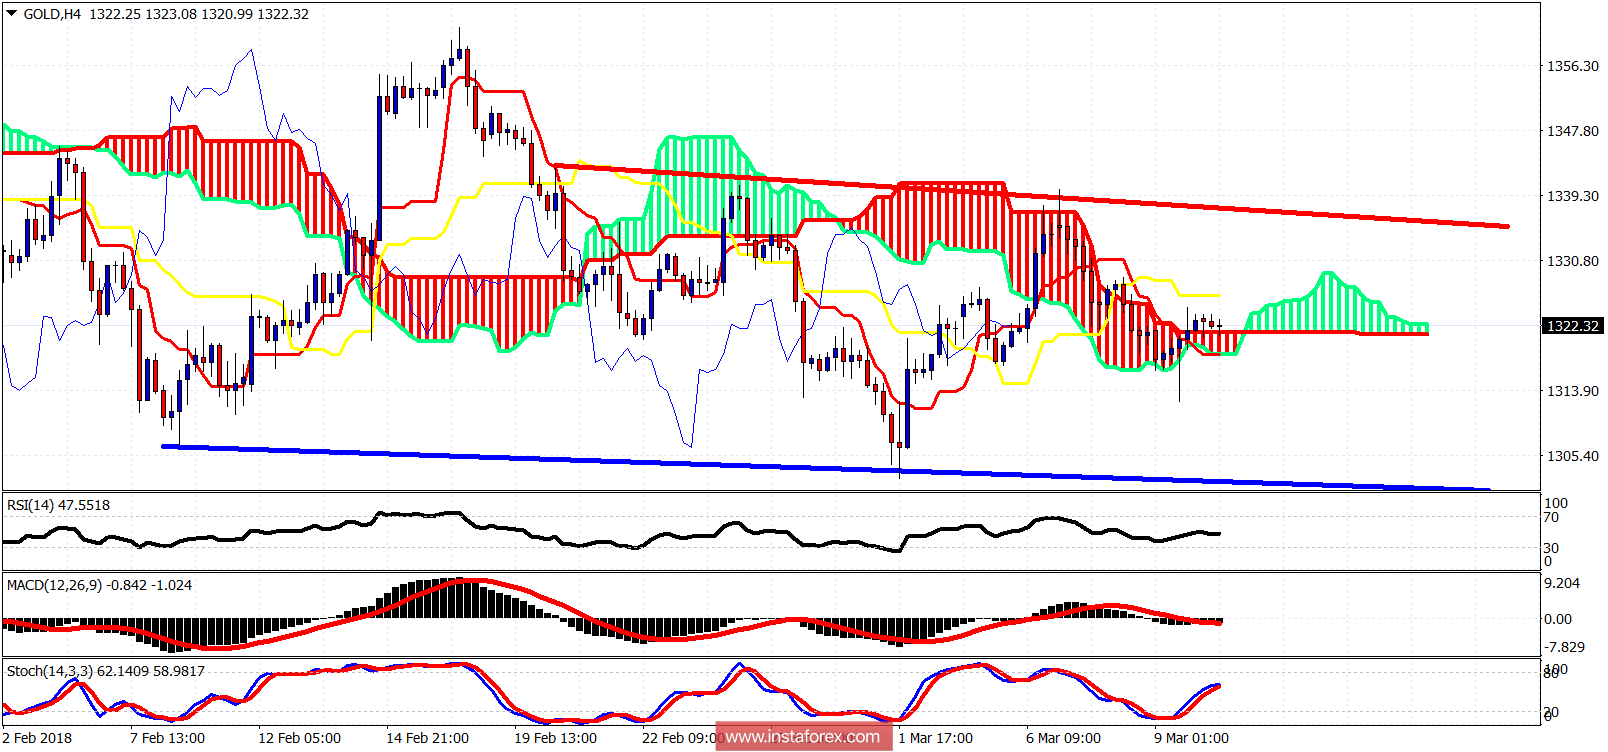
Red line - resistance
Blue line - support
The price is trading again above the 4hour Ichimoku cloud. The price reached again just above the $1,310 area and bounce towards the cloud area. Support is at $1,312.50 and resistance at the kijun-sen (yellow line indicator) at $1,326. There is no clear short-term trend.
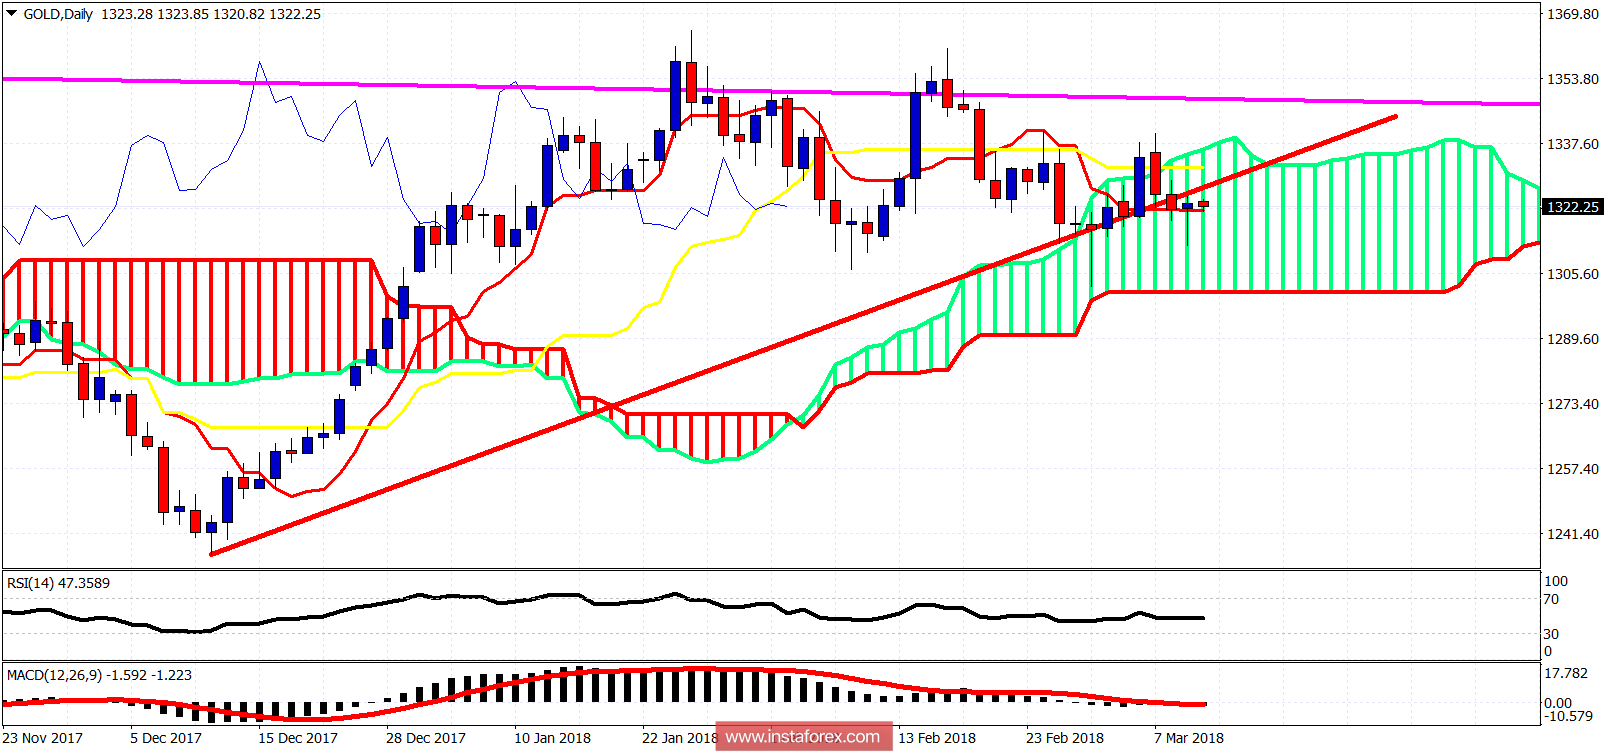
Magenta line - long-term resistance
Red line - support trend line
On a daily basis, the Gold price is inside the Daily Kumo. Trend is neutral. Support is at $1,300 while resistance is at $1,337-40. Long-term resistance is at $1,350 and we will get very bullish on a break above that area. Until then we prefer to remain cautious.