 English
  Русский
 Bahasa Indonesia
 Bahasa Malay
 ไทย
ไทย Español
 Deutsch
 Български
 Français
 Tiếng Việt
 中文
中文 বাংলা
বাংলা हिन्दी
 Čeština
 Українська
 Română

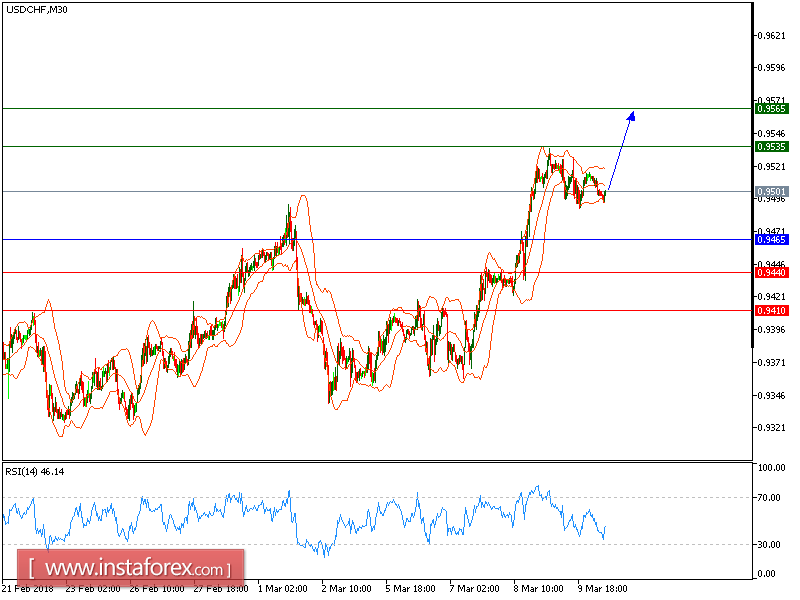
USD/CHF is expected to trade with bullish outlook. The pair is consolidating above the key support at 0.9485, which should allow for a temporary stabilization. The relative strength index has broken above the declining trend line since March 9 and crossed above the neutrality level at 50.
To sum up, above 0.9465, look for a further advance with targets at 0.9535 and 0.9565 in extension.
Chart Explanation: The black line shows the pivot point. The present price above the pivot point indicates a bullish position, and the price below the pivot point indicates a short position. The red lines show the support levels, and the green line indicates the resistance levels. These levels can be used to enter and exit trades.
Strategy: BUY, stop loss at 0.9465, take profit at 0.9535.
Resistance levels: 0.9535, 0.9565, and 0.9600
Support levels: 0.9440, 0.9410, and 0.9350.