 English
  Русский
 Bahasa Indonesia
 Bahasa Malay
 ไทย
ไทย Español
 Deutsch
 Български
 Français
 Tiếng Việt
 中文
中文 বাংলা
বাংলা हिन्दी
 Čeština
 Українська
 Română

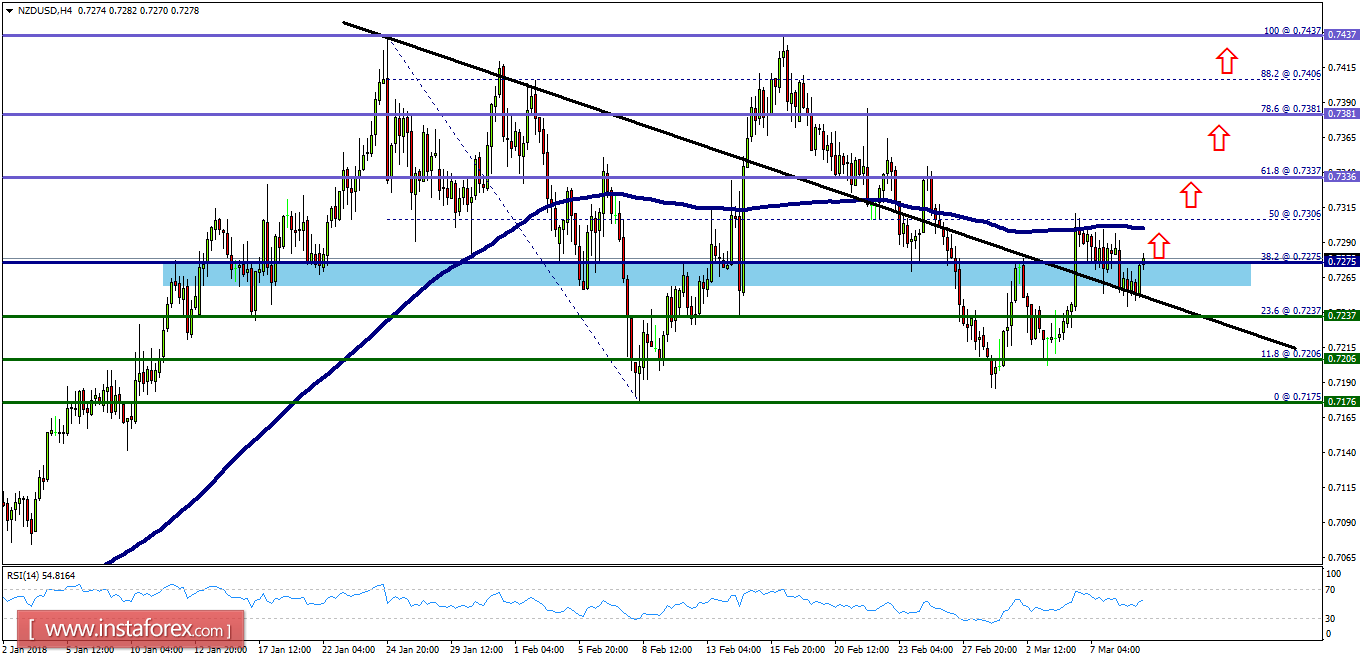
Overview:
- The NZD/USD pair is showing signs of strength following a breakout of the highest level of 0.7275. On the H1 chart, the level of 0.7275 coincides with 38.2% of Fibonacci, which is expected to act as minor support today. Since the trend is above the 50% Fibonacci level, the market is still in an uptrend. However, the major support is seen at the level of 0.7237. Furthermore, the trend is still showing strength above the moving average (100). Thus, the market is indicating a bullish opportunity above the mentioned support levels, for that the bullish outlook remains the same as long as the 100 EMA is headed to the upside. Therefore, strong support will be found at the level of 0.7275 providing a clear signal to buy with a target seen at 0.7336. If the trend breaks the minor resistance at 0.7336, the pair will move upwards continuing the bullish trend development to the level 0.7437 in order to test the double top.