English
  Русский
 Bahasa Indonesia
 Bahasa Malay
 ไทย
ไทย Español
 Deutsch
 Български
 Français
 Tiếng Việt
 中文
中文 বাংলা
বাংলা हिन्दी
 Čeština
 Українська
 Română

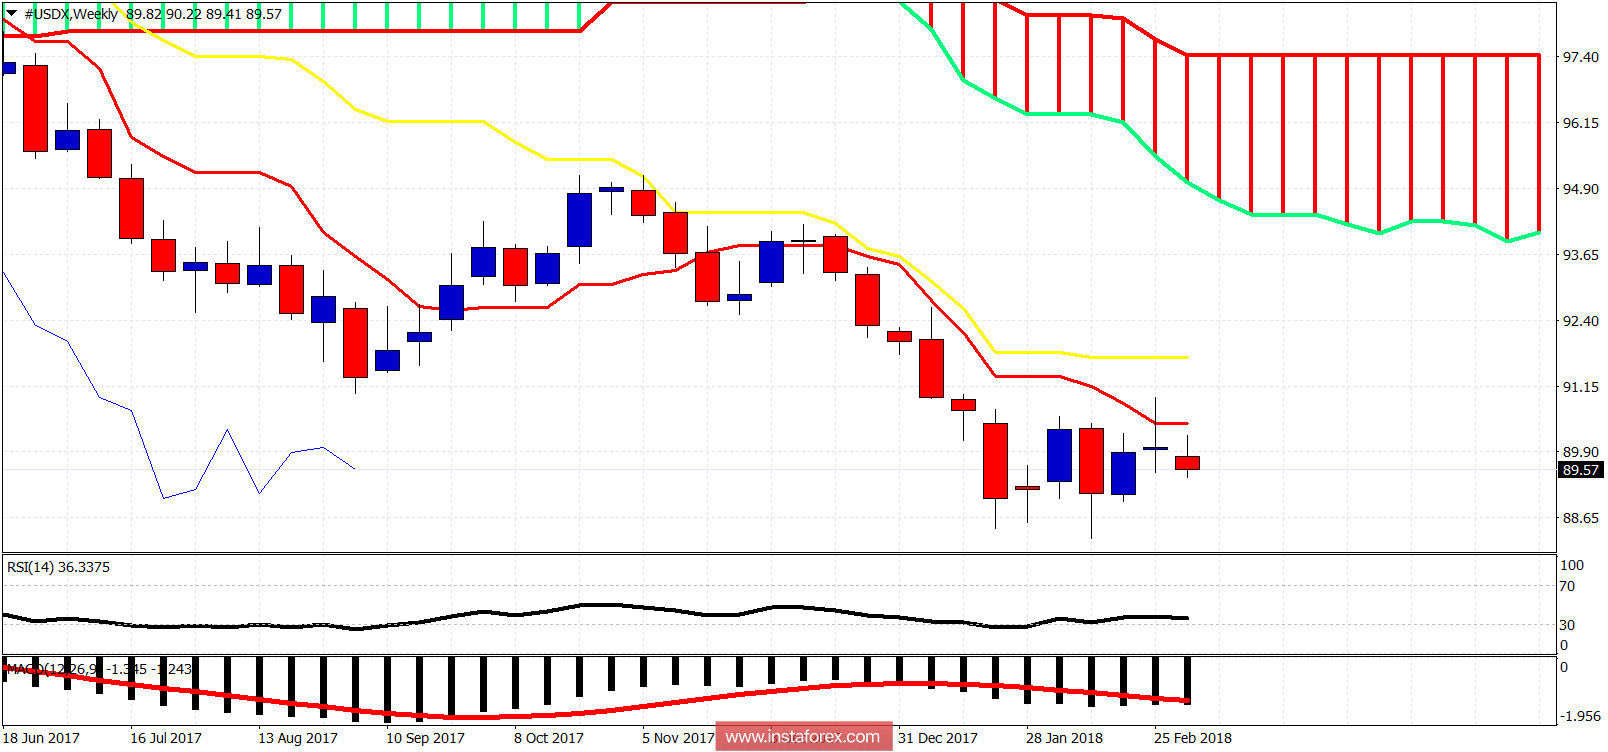
The Dollar index remains under pressure. Price has broken below the 4-hour Kumo and has turned short-term trend from neutral to bearish. Price continues to make lower lows and lower highs while trading below both the tenkan- and kijun-sen.
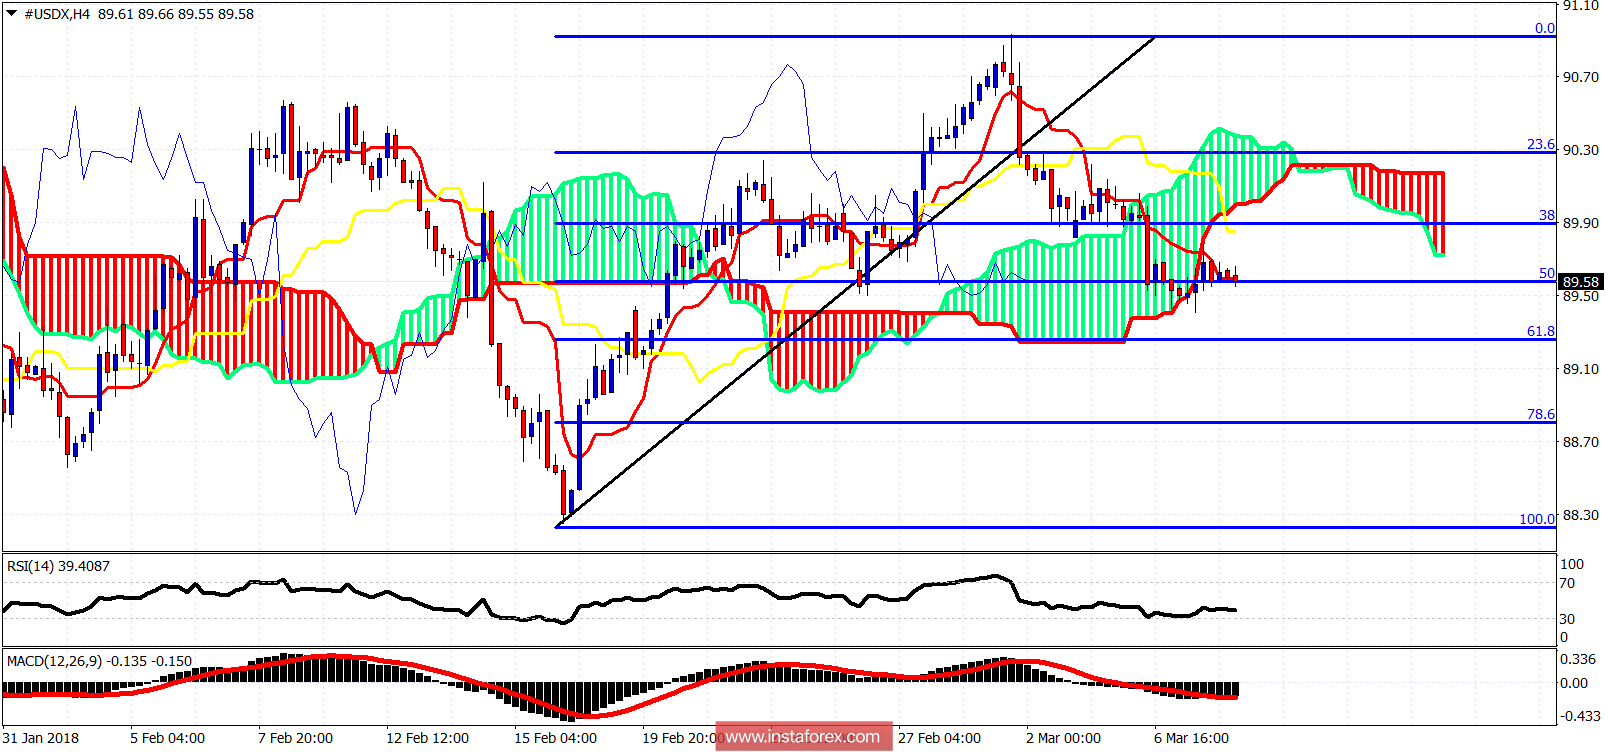
Next important short-term support is at 89.25 where we find the 61.8% Fibonacci retracement. As long as price is below the Kumo trend will be bearish. For trend to change to bullish in the 4hour chart we will need to see a break above 90.40. Price could bounce from the 61.8% Fibonacci retracement and move higher to test the cloud from below.