 English
  Русский
 Bahasa Indonesia
 Bahasa Malay
 ไทย
ไทย Español
 Deutsch
 Български
 Français
 Tiếng Việt
 中文
中文 বাংলা
বাংলা हिन्दी
 Čeština
 Українська
 Română

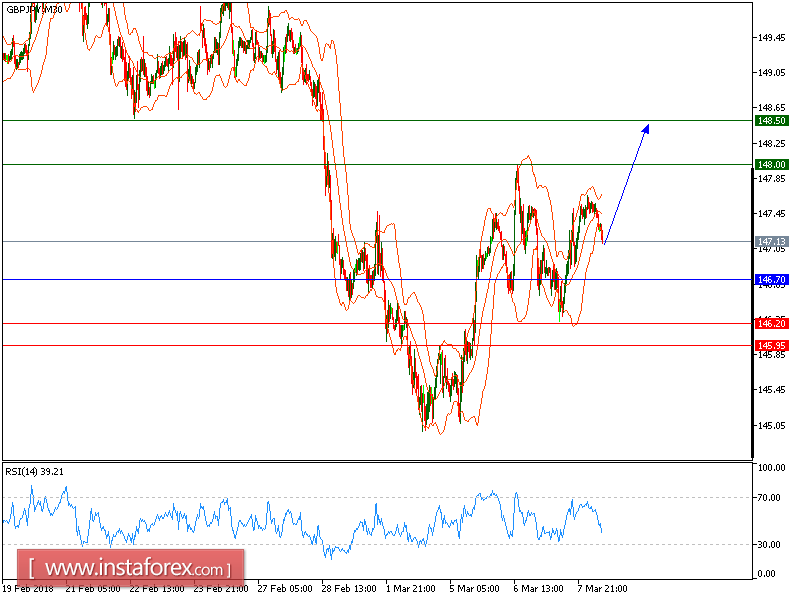
GBP/JPY is expected to trade with a bullish outlook. The pair posted a rebound and broke above its 20-period and 50-period moving averages. Additionally, the golden cross between 20-period and 50-period moving averages has been identified. The relative strength index is supported by an ascending trend line.
Hence, as long as 146.70 is not broken, look for a further rise with targets at 148 and 148.50 in extension.
Alternatively, if the price moves in the direction opposite to the forecast, a long position is recommended to be above 146.50 with the target at 147.45.
Strategy: BUY, Stop loss at 146.70, Take profit at 148.00
Chart Explanation: The black line shows the pivot point. The price above the pivot point indicates long positions; and when it is below the pivot point, it indicates short positions. The red lines show the support levels, and the green line indicates the resistance levels. These levels can be used to enter and exit trades.
Resistance levels: 148.00, 148.50, and 149.10
Support levels: 146.20, 145.95, and 144.00