 English
  Русский
 Bahasa Indonesia
 Bahasa Malay
 ไทย
ไทย Español
 Deutsch
 Български
 Français
 Tiếng Việt
 中文
中文 বাংলা
বাংলা हिन्दी
 Čeština
 Українська
 Română

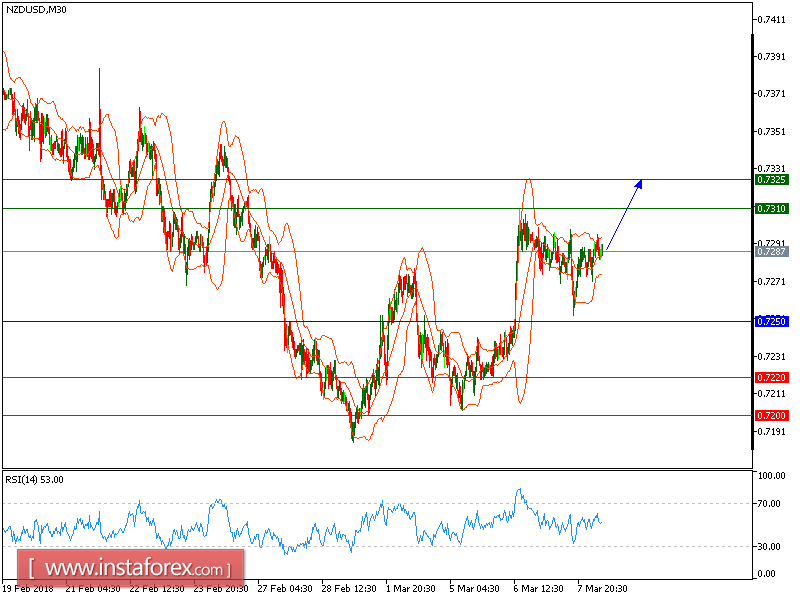
NZD/USD is expected to trade with a bullish outlook. The pair rebounded from 0.7250 and broke above both 20-period and 50-period moving averages. The relative strength index is bullish above its neutrality level at 50, calling for a further upside.
Hence, as long as 0.7250 holds on the downside, a new challenge to 0.7310 and even to 0.7325 is expected.
The black line shows the pivot point. Currently, the price is above the pivot point which is a signal for long positions. If it remains below the pivot point, it will indicate short positions. The red lines show the support levels, while the green line indicates the resistance levels. These levels can be used to enter and exit trades.
Resistance levels: 0.7310, 0.7325, and 0.7365.
Support levels: 0.7245, 0.7215, and 0.7175.