 English
  Русский
 Bahasa Indonesia
 Bahasa Malay
 ไทย
ไทย Español
 Deutsch
 Български
 Français
 Tiếng Việt
 中文
中文 বাংলা
বাংলা हिन्दी
 Čeština
 Українська
 Română

The Dollar index broke below support of 89.80 yesterday and is now testing the lower cloud boundary in the 4-hour chart. Trend has changed from bullish to neutral and is very close to turning bearish.
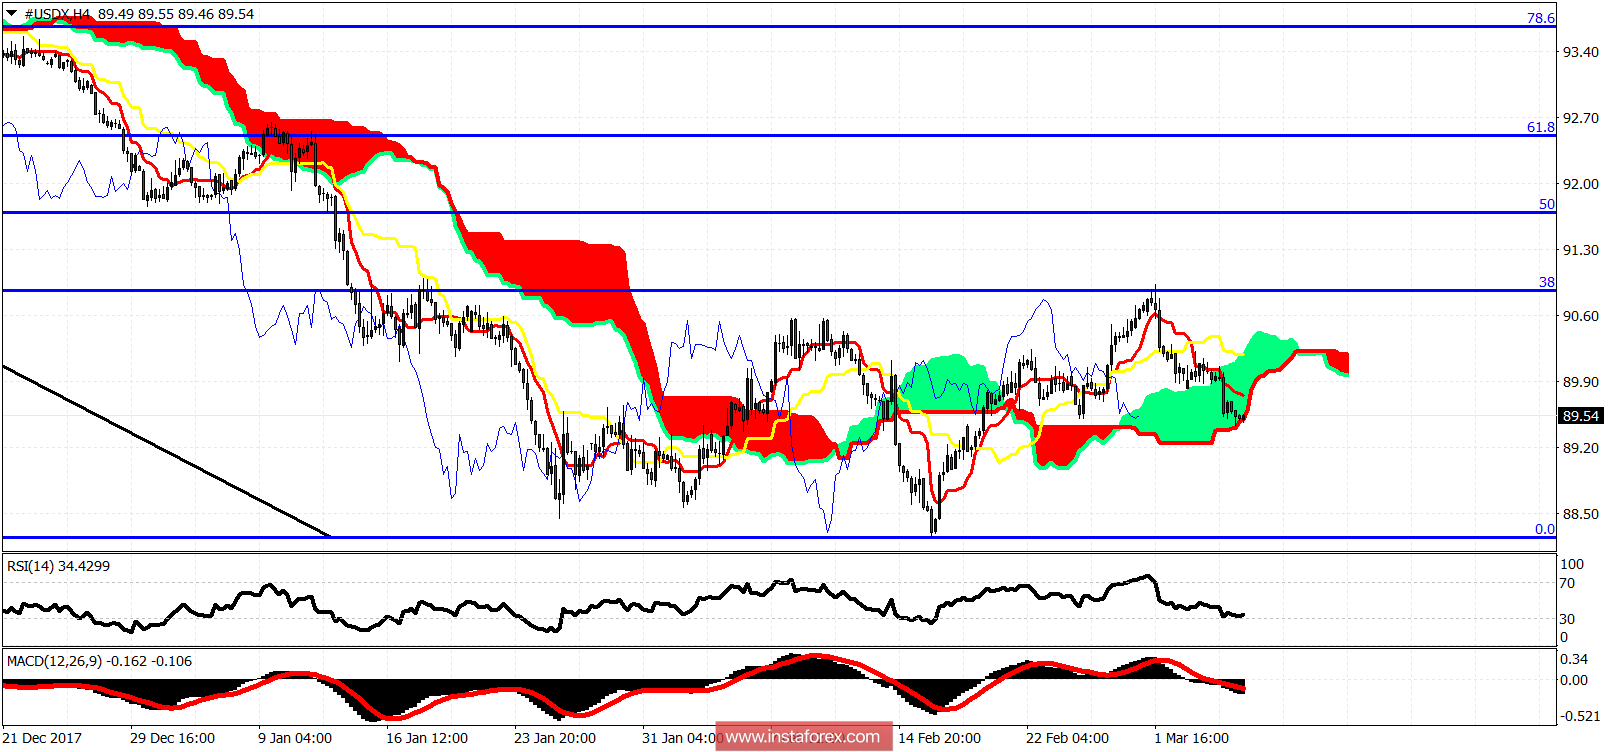
After being rejected at the resistance of the 38% Fibonacci retracement, the Dollar index is making lower lows and lower highs in the 4 hour chart. Price has broken below all short-term support levels we mentioned and is now testing the cloud support. Resistance is at 89.75 and bulls will need to at least break above this level soon.
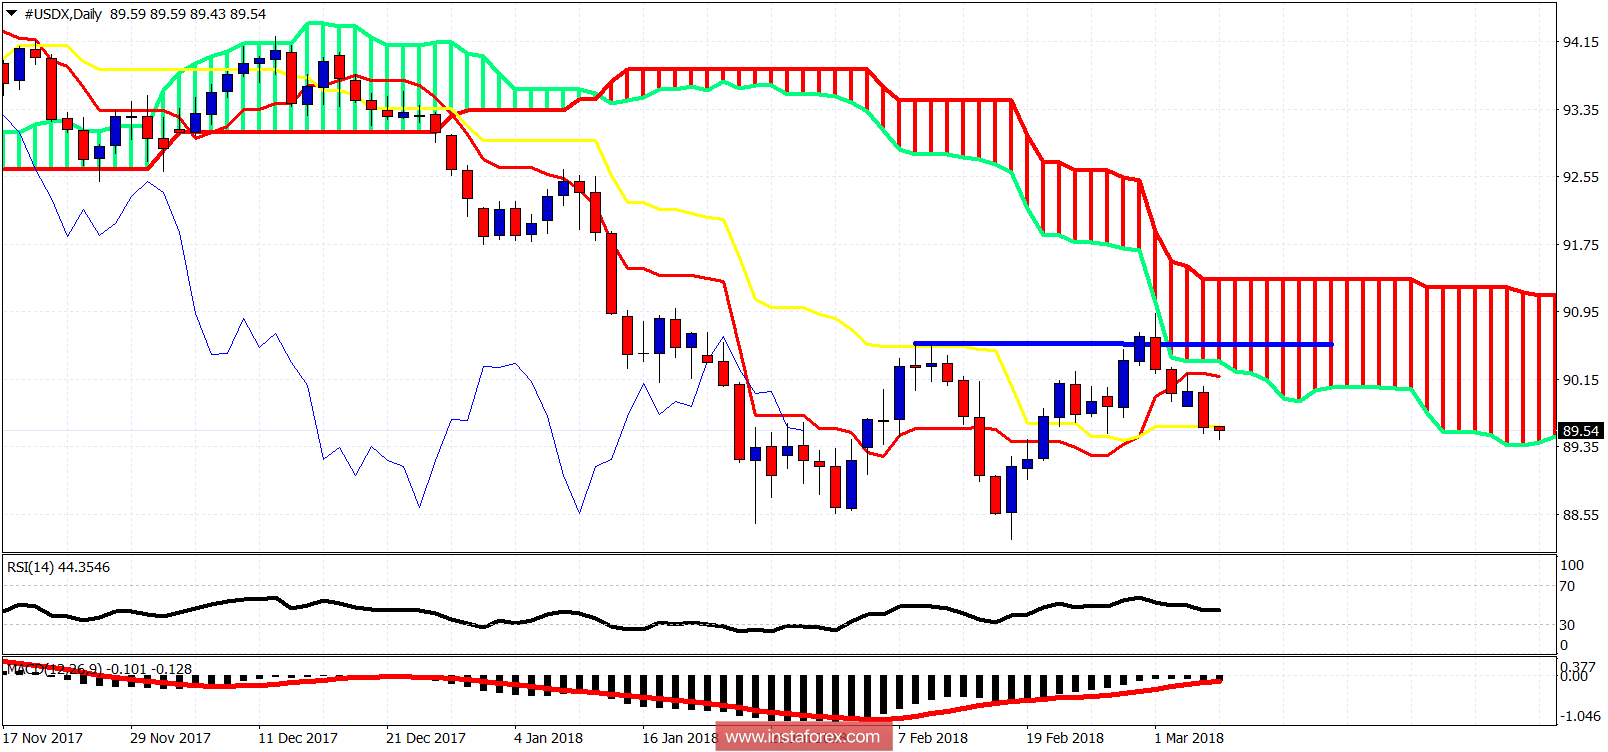
On a daily basis the Dollar index is trading just above the daily kijun-sen support. Bulls want to see buyers step in now and push the index higher. They do not want to see a daily close below the kijun-sen. With price still below the daily cloud, trend remains bearish. Strong resistance is at 90.40 This is the first important obstacle bulls must overcome. Until then, bears are in control.