 English
  Русский
 Bahasa Indonesia
 Bahasa Malay
 ไทย
ไทย Español
 Deutsch
 Български
 Français
 Tiếng Việt
 中文
中文 বাংলা
বাংলা हिन्दी
 Čeština
 Українська
 Română

Gold price is now in a neutral short-term trend after entering inside the Ichimoku cloud of the 4-hour chart. Price reached the upper cloud boundary and got rejected. Gold continues to trade inside a range of $1,310-$1,350.
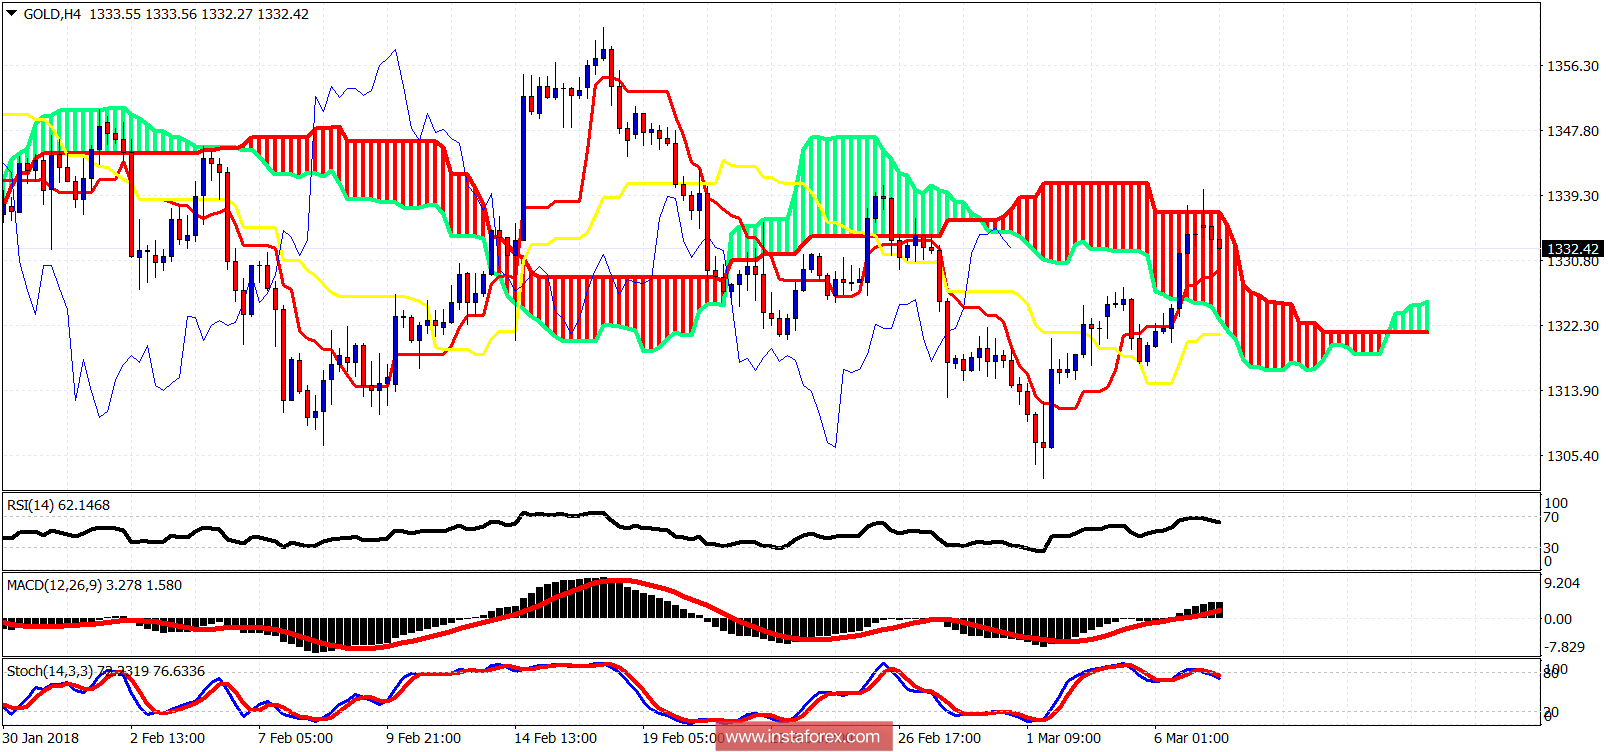
Red trend line -support
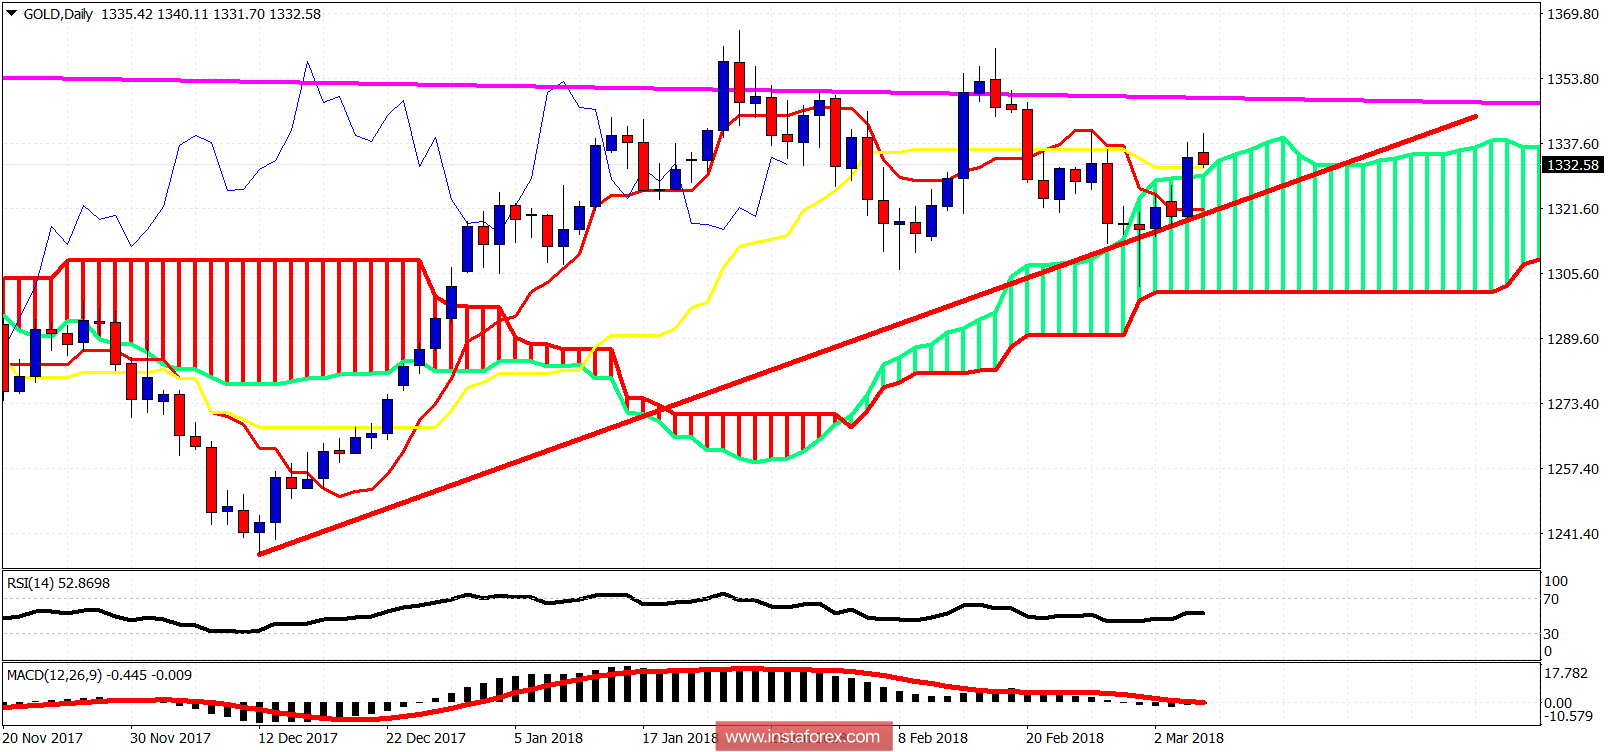
On a daily basis Gold price managed to break and close above the daily Kumo. This is a bullish sign. As long as price does not close back inside the Kumo. If this happens, we should expect a move back towards $1,300-$1,310. The most bullish sign would be to see a break above the long-term resistance trend line (magenta line).