 English
  Русский
 Bahasa Indonesia
 Bahasa Malay
 ไทย
ไทย Español
 Deutsch
 Български
 Français
 Tiếng Việt
 中文
中文 বাংলা
বাংলা हिन्दी
 Čeština
 Українська
 Română

The index stays under pressure below the 200 SMA on the H1 chart after having a sellers' wave during Tuesday's session. As the greenback is weakening, we can expect a test of the support zone at 89.36, at which a breakout should expose the 87.88 level. To the upside, gains will be limited by the 90.63 area.
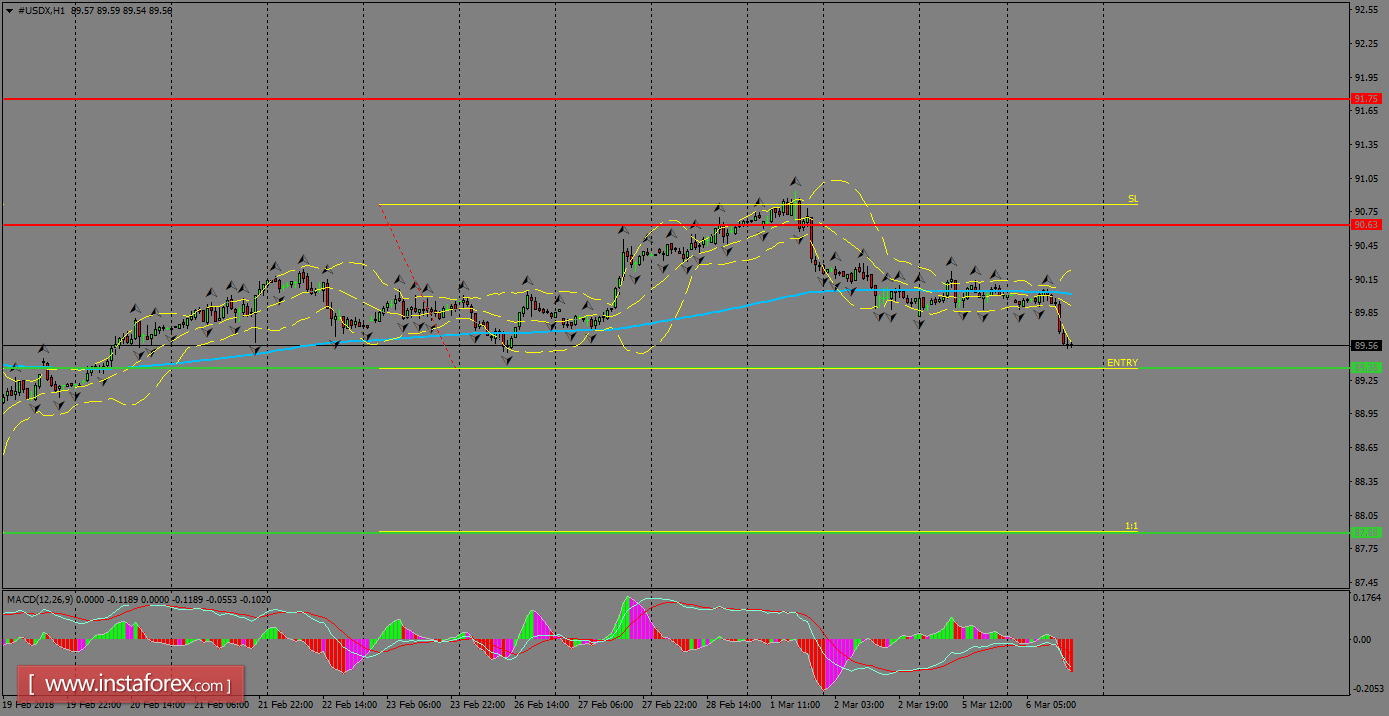
H1 chart's resistance levels: 90.63 / 91.75
H1 chart's support levels: 89.36 / 87.88
Trading recommendations for today: Based on the H1 chart, place sell (short) orders only if the USD Index breaks with a bearish candlestick; the support level is at 89.36, take profit is at 87.88 and stop loss is at 90.81.