 English
  Русский
 Bahasa Indonesia
 Bahasa Malay
 ไทย
ไทย Español
 Deutsch
 Български
 Français
 Tiếng Việt
 中文
中文 বাংলা
বাংলা हिन्दी
 Čeština
 Українська
 Română

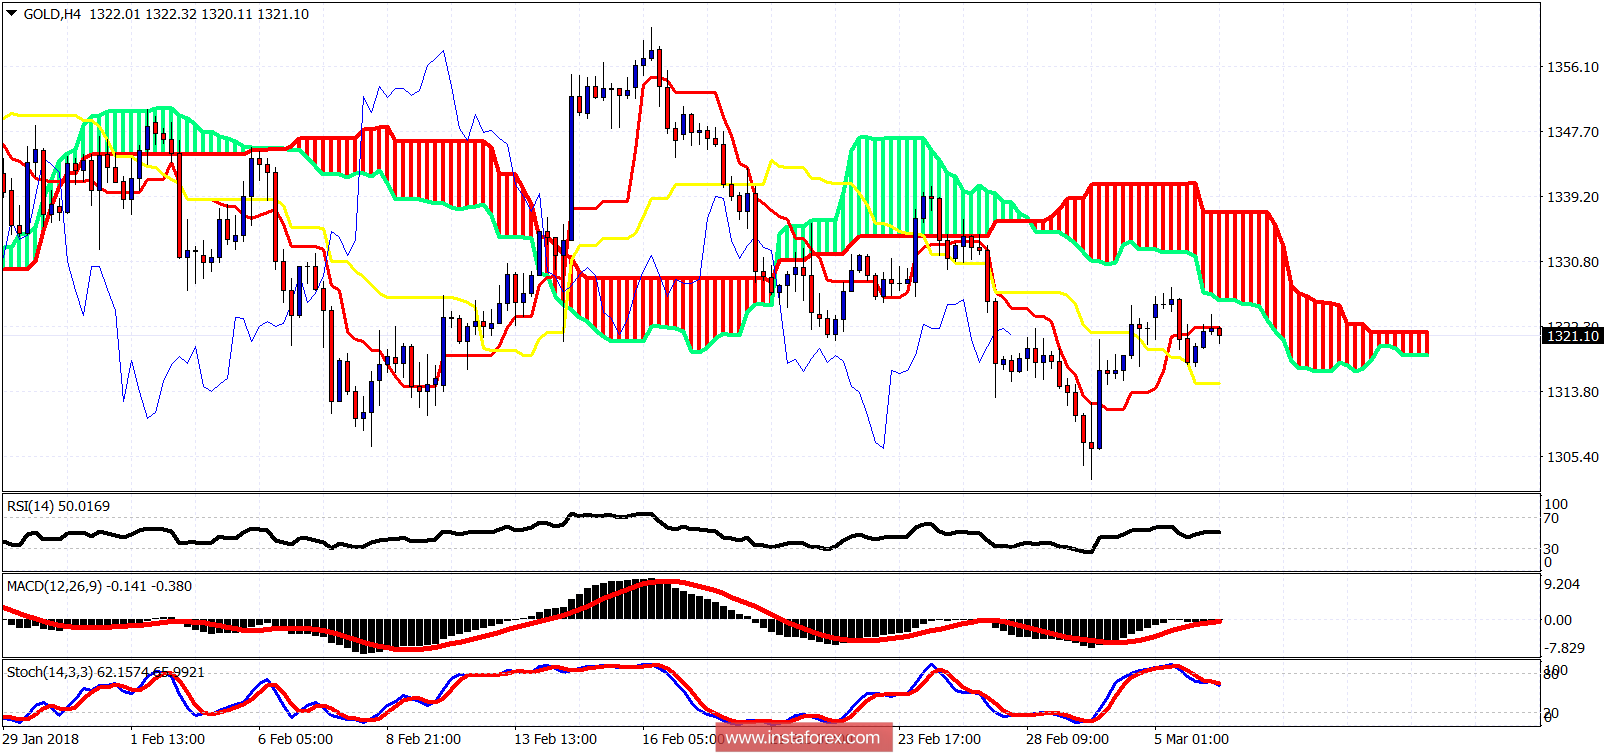
Gold price tried to move towards the resistance of $1,330 but bulls were unable to hold the price above the tenkan-sen at $1,321-23. Trend remains bearish. Price is still below the 4hour cloud.
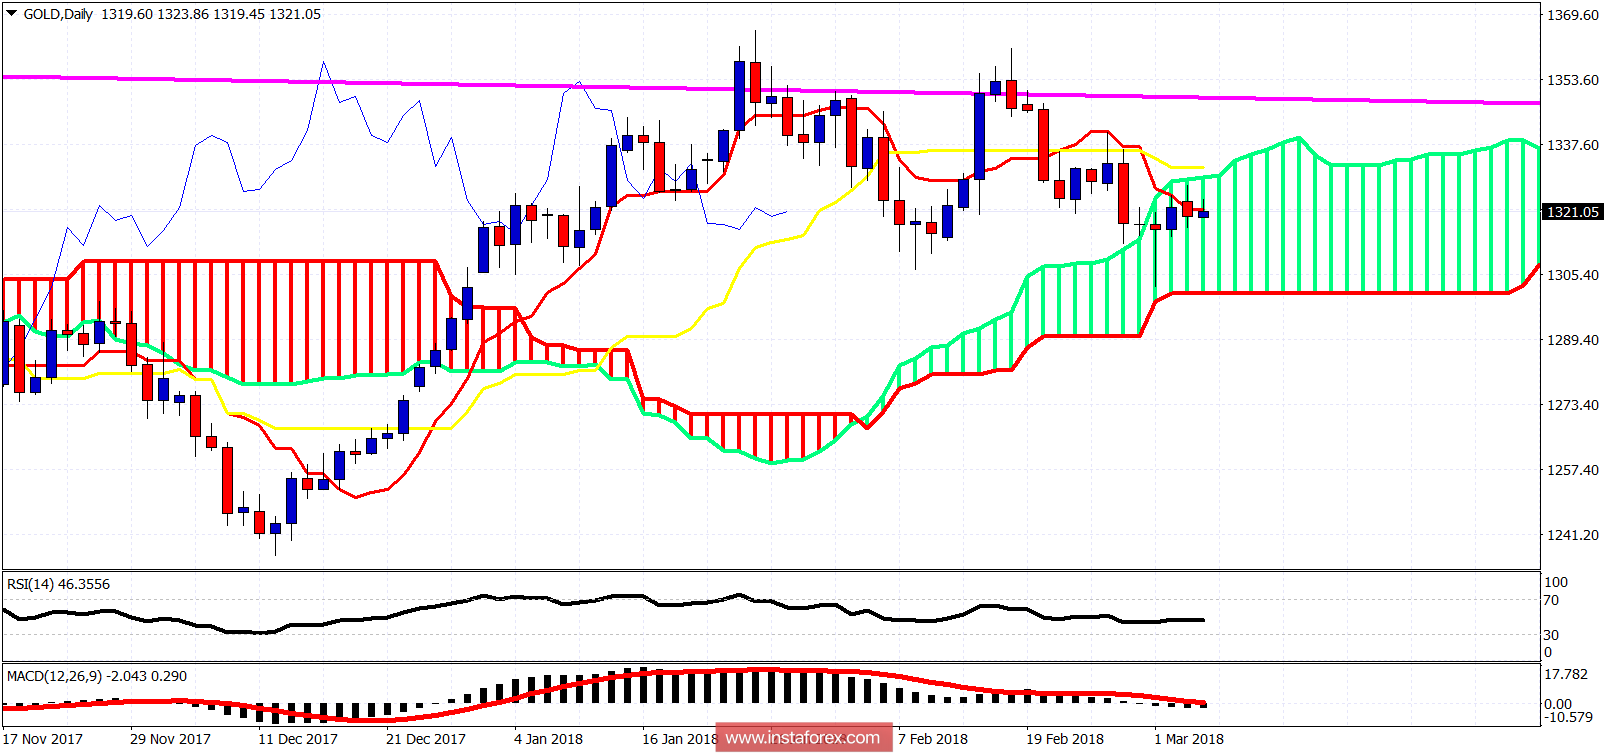
In the daily chart the price got rejected at the upper cloud boundary and is challenging the tenkan-sen support at $1,320. A daily close below it will push the price again towards the lower boundary towards $1,300. A break below $1,300 will push the price towards $1,280. This is my preferred scenario so far.