 English
  Русский
 Bahasa Indonesia
 Bahasa Malay
 ไทย
ไทย Español
 Deutsch
 Български
 Français
 Tiếng Việt
 中文
中文 বাংলা
বাংলা हिन्दी
 Čeština
 Українська
 Română

USDX still hovers around the 200 SMA at the H1 chart and it's trying to gather momentum in order to continue with the bullish structure above it. However, a pullback to test the support zone of 89.36 could be tested in the near-term and it could get a break to open the doors towards the 87.88 level. To the upside, the nearest resistance lies at 90.63.
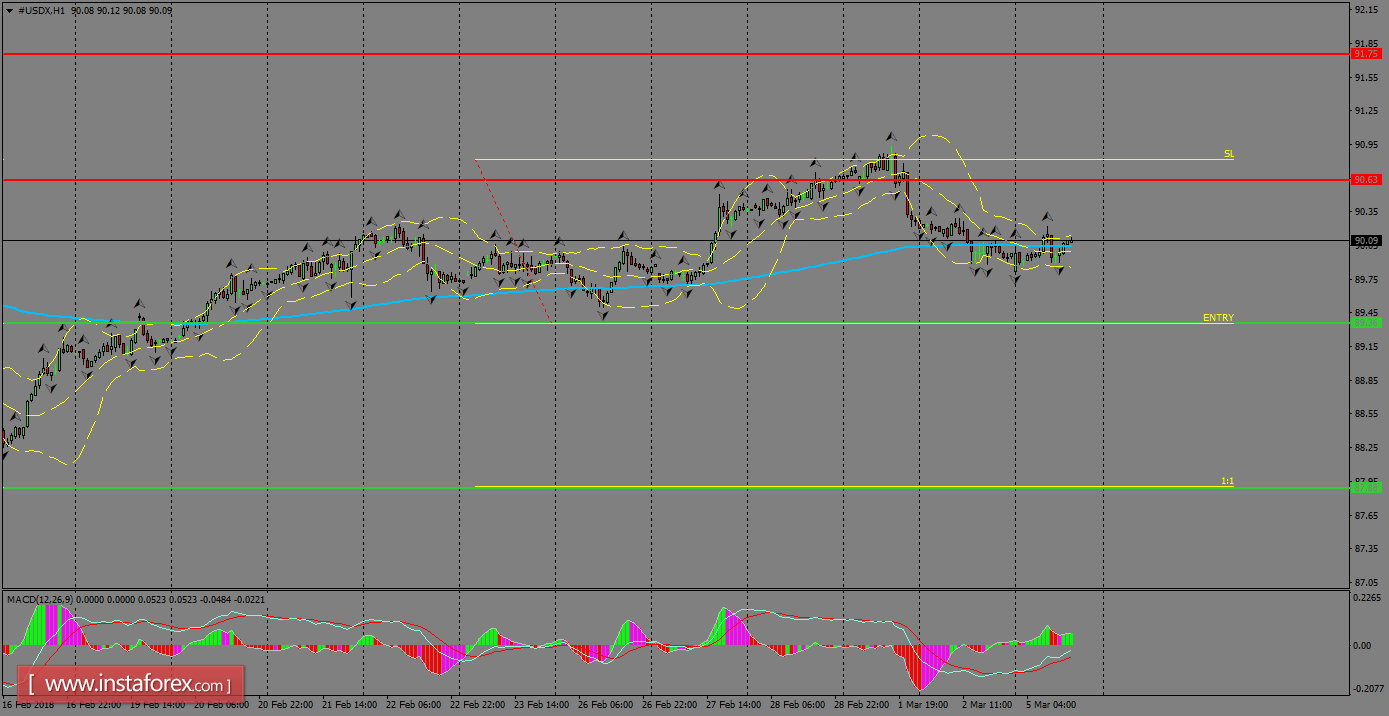
H1 chart's resistance levels: 90.63 / 91.75
H1 chart's support levels: 89.36 / 87.88
Trading recommendations for today: Based on the H1 chart, place sell (short) orders only if the USD Index breaks with a bearish candlestick; the support level is at 89.36, take profit is at 87.88 and stop loss is at 90.81.