 English
  Русский
 Bahasa Indonesia
 Bahasa Malay
 ไทย
ไทย Español
 Deutsch
 Български
 Français
 Tiếng Việt
 中文
中文 বাংলা
বাংলা हिन्दी
 Čeština
 Українська
 Română

The index is off from February 28th highs and currently it's trading below the 200 SMA, as the support zone of 89.36 could be challenged anytime soon. However, if USDX manages to break below that area, it's expected to test the 87.88 level, which should strengthen the bearish bias for the short-term. MACD indicator remains in the positive territory.
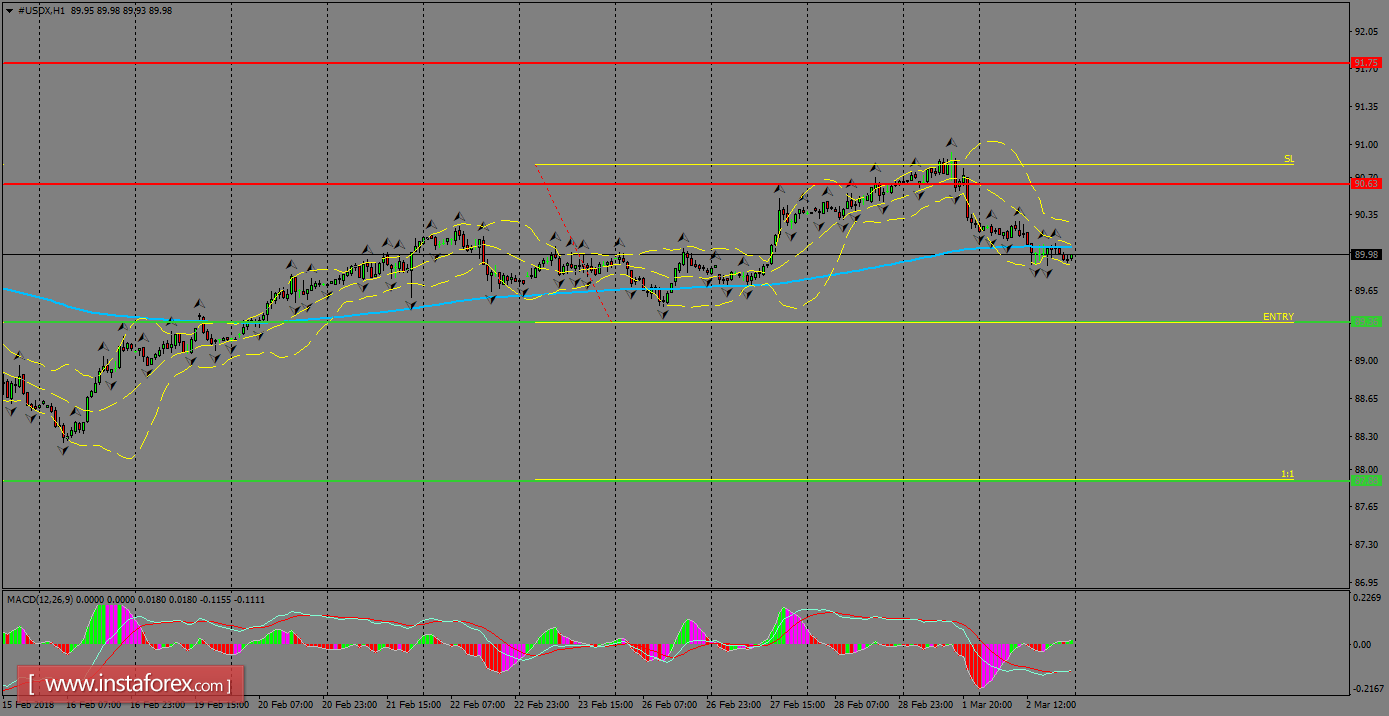
H1 chart's resistance levels: 90.63 / 91.75
H1 chart's support levels: 89.36 / 87.88
Trading recommendations for today: Based on the H1 chart, place sell (short) orders only if the USD Index breaks with a bearish candlestick; the support level is at 89.36, take profit is at 87.88 and stop loss is at 90.81.